Google Classroom
Google Classroom
GeoGebra
GeoGebra Classroom
Sign in
Search
Google Classroom
Google Classroom
GeoGebra
GeoGebra Classroom
Outline
AP Stats
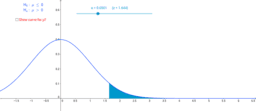
Power and Error Rates for a z-Based Hypothesis Test
AP Stats
Author:
Paula Torres
Power and Error Rates for a z-Based Hypothesis Test
Next
Power and Error Rates for a z-Based Hypothesis Test
New Resources
Nikmati Keunggulan Di Bandar Judi Terpercaya
Model sferyczny - sześcian-ośmiościan
Random Polar Curve (3)
Slope and Road Signs
Rose Curve
Discover Resources
Rectangular and Polar Graphing of Trig Functions
locus_ruins_export
One pair opp sides equal
Фиг 20
TAnnerHoward
Discover Topics
Mathematics
Rectangle
Correlation
Unit Circle
Quadratic Equations