Extremums Using Derivatives: The First Derivative Test
A derivative function has so many capabilities. Did you know you can find a function's local extremum using only its derivative? This is an essential skill in calculus, because there may be situations where no calculator is allowed, and/or you aren't given the original function or its graph.
The Plan:- Explore the relationship between local extrema and derivative functions
- identify extremums of a function (ie. maximums, minimums) on an open interval by using the First Derivative Test
- conclusion
Do you think you can do it? Let's explore!
Exploration
Look the graph below. The local extrema are marked: points A, C are local minimums; point B is a local maximum.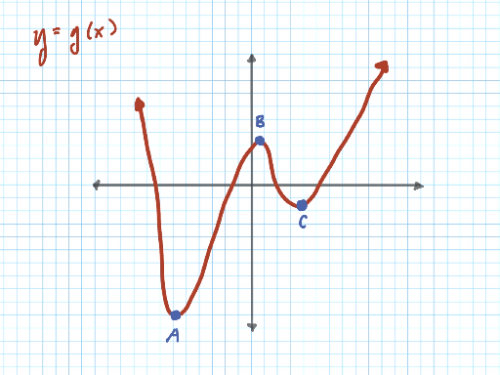
What do you notice about the graph surrounding the local extrema?
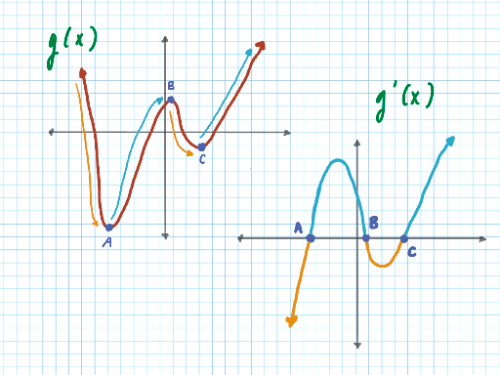
![The [color=#ff7700]orange[/color] indicates where [math]g[/math] is decreasing, and the [color=#1e84cc]turquoise[/color] indicates where [math]g[/math] is increasing.](https://www.geogebra.org/resource/s47qru6k/2Gizhk3Y4zWJVNDt/material-s47qru6k.png)
![The [color=#ff7700]orange[/color] indicates where the function is decreasing, the [color=#1e84cc]turquoise[/color] indicates where the function is increasing, and the [color=#ff00ff]pink[/color] indicates local extrema.](https://www.geogebra.org/resource/q4ekakyq/WTwxIfKbEF0VQgBK/material-q4ekakyq.png)
![The [color=#ff7700]orange[/color] indicates where [math]g'[/math] is negative, and the [color=#1e84cc]turquoise[/color] indicates where [math]g'[/math] is positive.](https://www.geogebra.org/resource/avd3fkzy/WdxDqDOz3WwF5Zc5/material-avd3fkzy.png)
Look at the graph of again. What do you notice about the graph surrounding the critical points?
The derivative of local extremums A, B, C are also critical points. What can we conclude from this?
We know A and C are local minimums. Look at A and C on : what happens to the graph at these points?
We know B is a local maximum. Look at B on : what happens to the graph at this point?
Now let's apply what we learned to a problem.
The First Derivative Test
The function is continuous and differentiable for all x. Without a calculator, find the coordinates of the local minimum and maximum of if .
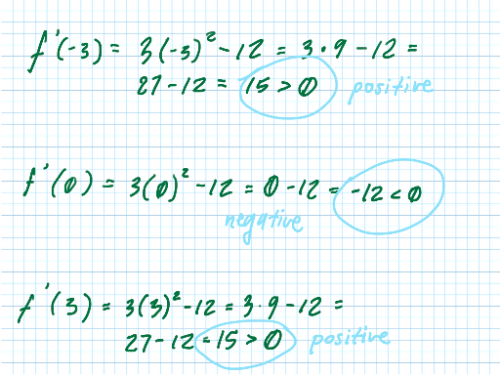
What is the derivative of ?
If , x = ?
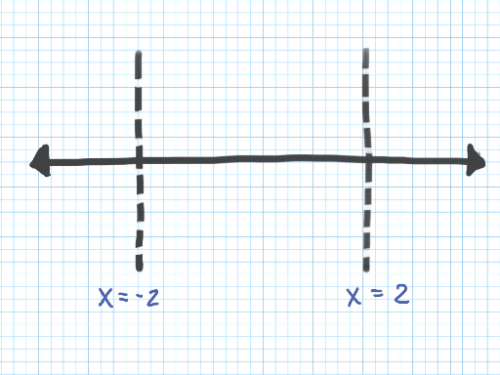
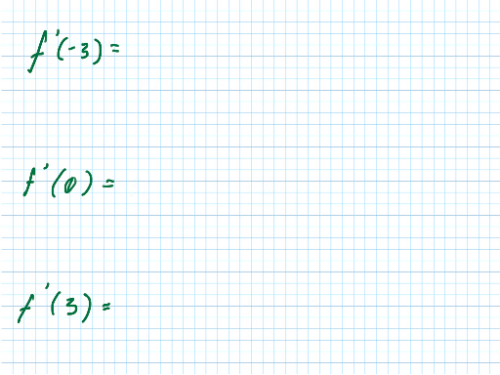
, ,
Great!
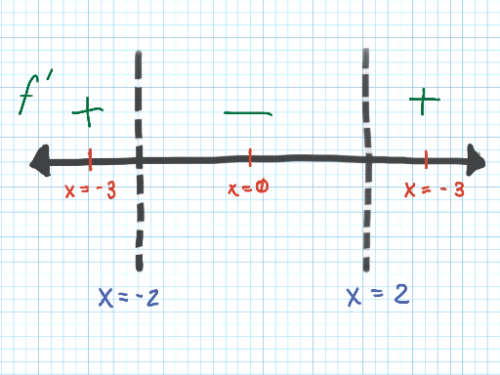
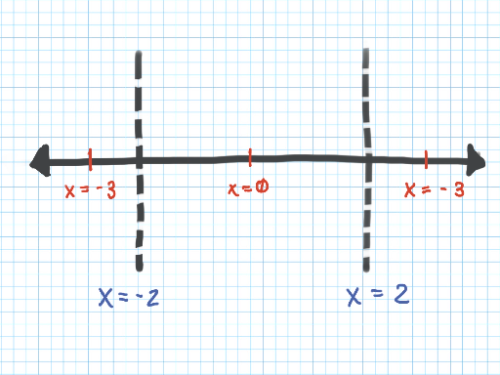
At what x-value does the local maximum occur? Justify your answer.
At what x-value does the local minimum occur? Justify your answer.
The local maximum occurs at (__,__). The local minimum occurs at (__, __).
Conclusion