Introduction to the Correlation Coefficient
Prediction
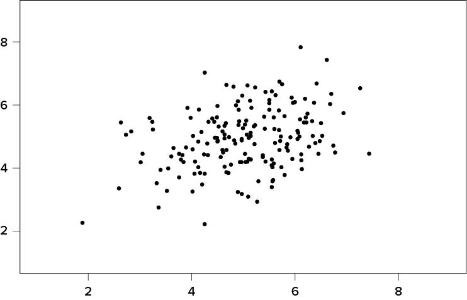
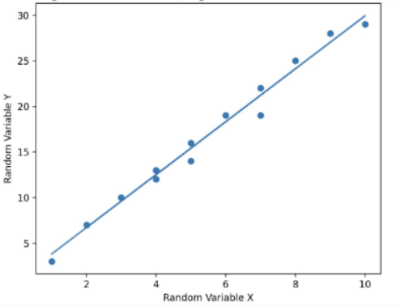
In 8th grade, you talked about correlation given a set of data while predicting a line of best fit. Looking at the picture of the two graphs above. Each of these has a positive correlation, do you predict that the relationships are equally as strong?
Explore how data sets correspond to the correlation coefficient and interpret its meaning.
Putting It All Together
Use the above simulation to answer the questions.
What does it mean when ?
What does it mean when ?
In your own words, describe what a data set might look like if ?
Enrichment
What would a graph with a correlation coefficient of 0 look like? What does that specifically mean about the data?
Final Check In
If you are told a data set shows a linear relationship, what could you expect to see for the correlation coefficient ?