Google Classroom
Google Classroom
GeoGebra
GeoGebra Classroom
Abrir sesión
Buscar
Google Classroom
Google Classroom
GeoGebra
GeoGebra Classroom
Esquema
Probability and Statistics 1.4 Dot plots
Lesson 1.4
Practice 1.4
Teacher Resources 1.4
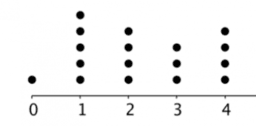
Probability and Statistics 1.4 Dot plots
Autor:
MEI KS3 Interactive Resources
,
IM 6 – 8 Math
,
GeoGebra Classroom Activities
These resources have been adapted by MEI from
“Dot Plots”
from IM Grade 6 by
Open Up Resources
and Illustrative Mathematics. Licensed under the
Creative Commons Attribution 4.0 license
.
Tabla de contenidos
Lesson 1.4
Probability and Statistics 1.4 Lesson: Dot plots
Practice 1.4
Probability and Statistics 1.4 Practice: Dot plots
Teacher Resources 1.4
Probabiity and Statistics 1.4
Siguiente
Probability and Statistics 1.4 Lesson: Dot plots
Nuevos recursos
seo tool
Cartesian vs Polar
z`]]
apec
Rose Curve
Descubrir recursos
Rotation Tessellation Triangle Step 2
Aquatic Oxygen Use
ITA Circonferenze 1
McGarrityKateFunctionProject2017
Descubre temas
Media Geométrica
Triángulos
Sólidos
Mediana
Derivada