Piecewise Linear Functions
Drills
What do you notice? What do you wonder?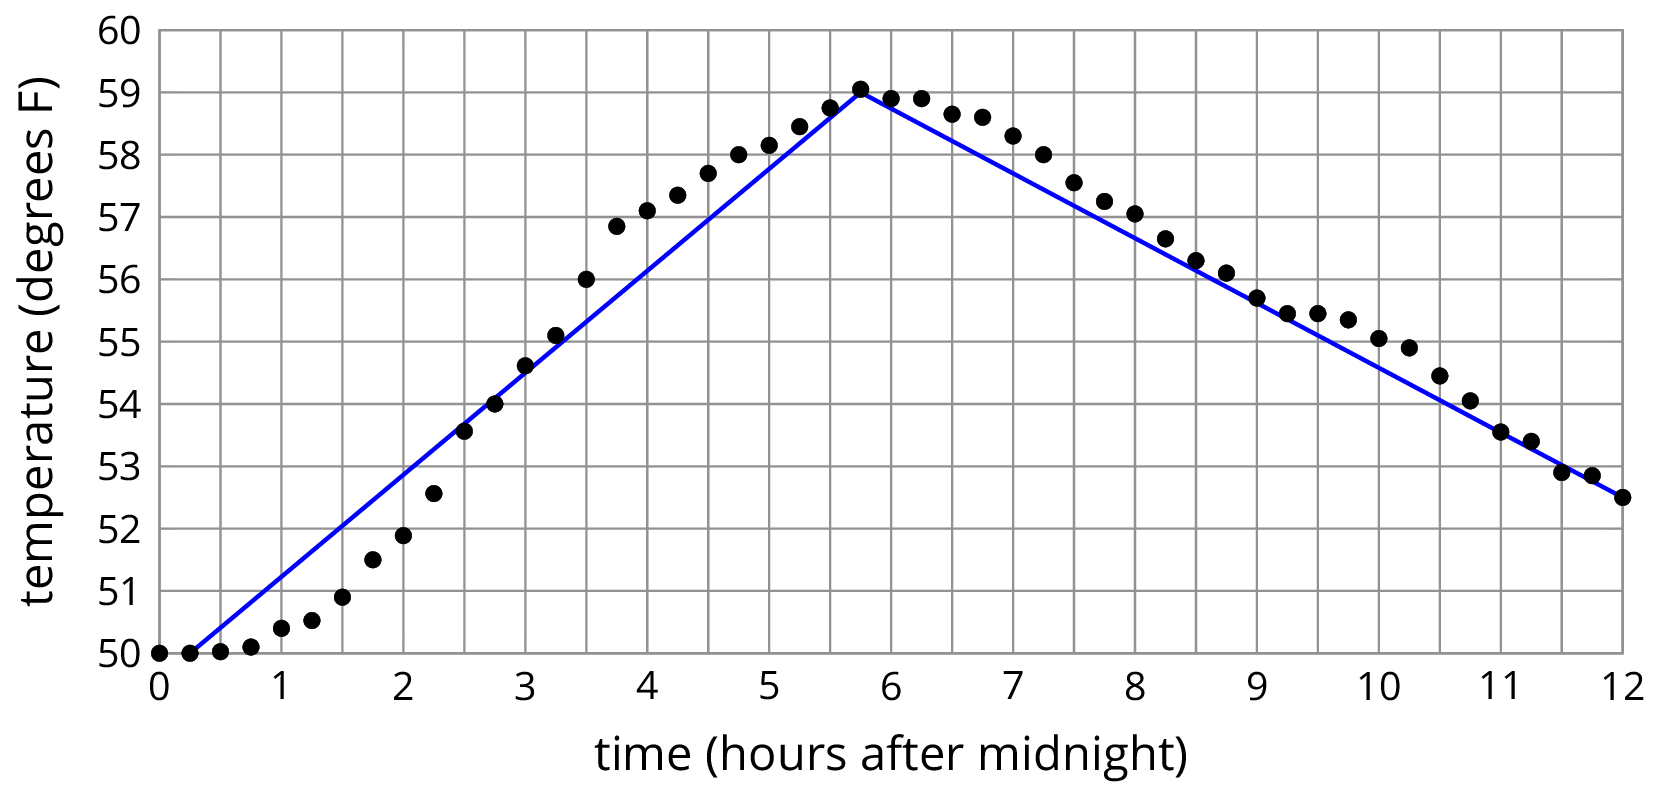
Answers
Things students may notice:
- Not many of the points are on the blue line.
- The temperature gets warmer and then cooler as time goes on.
- At about 5:45 it is the warmest at about 59 degrees.
- The second blue line connects the highest point and the point furthest to the right.
- What location does this data represent?
- Why is it warmer at 6:00 am then it is at noon?
- Why aren’t the points connected?
- Why is the second line lower than almost all the points?
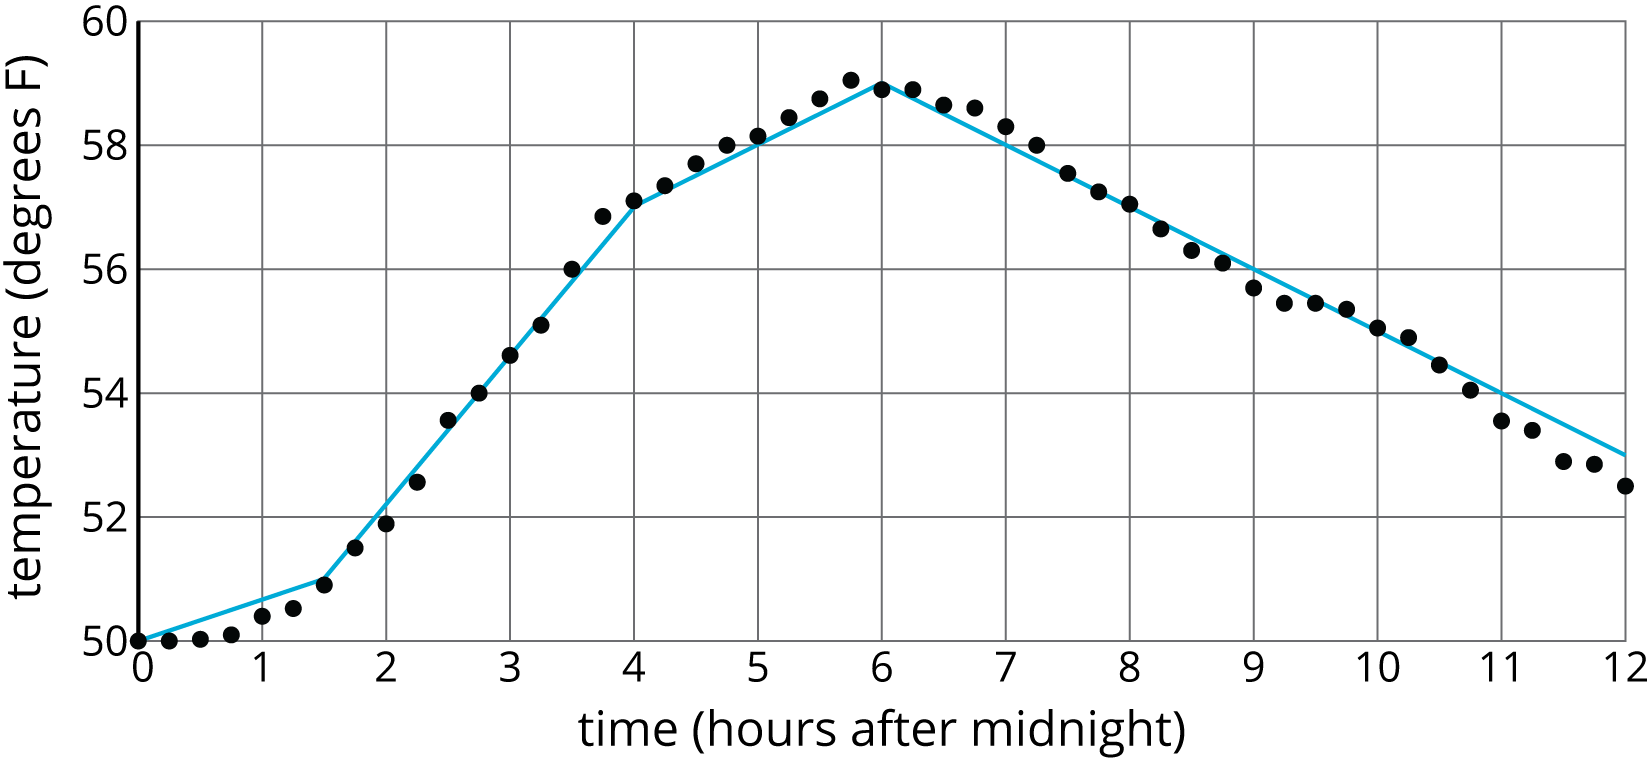
Arrange students in groups of 2. Display images for all to see. Tell students that sometimes we model functions with multiple line segments in different places. These models are called piecewise linear functions. For example, here are two different piecewise linear models of the same temperature data (note that the first image is not the same as the image in the warm-up):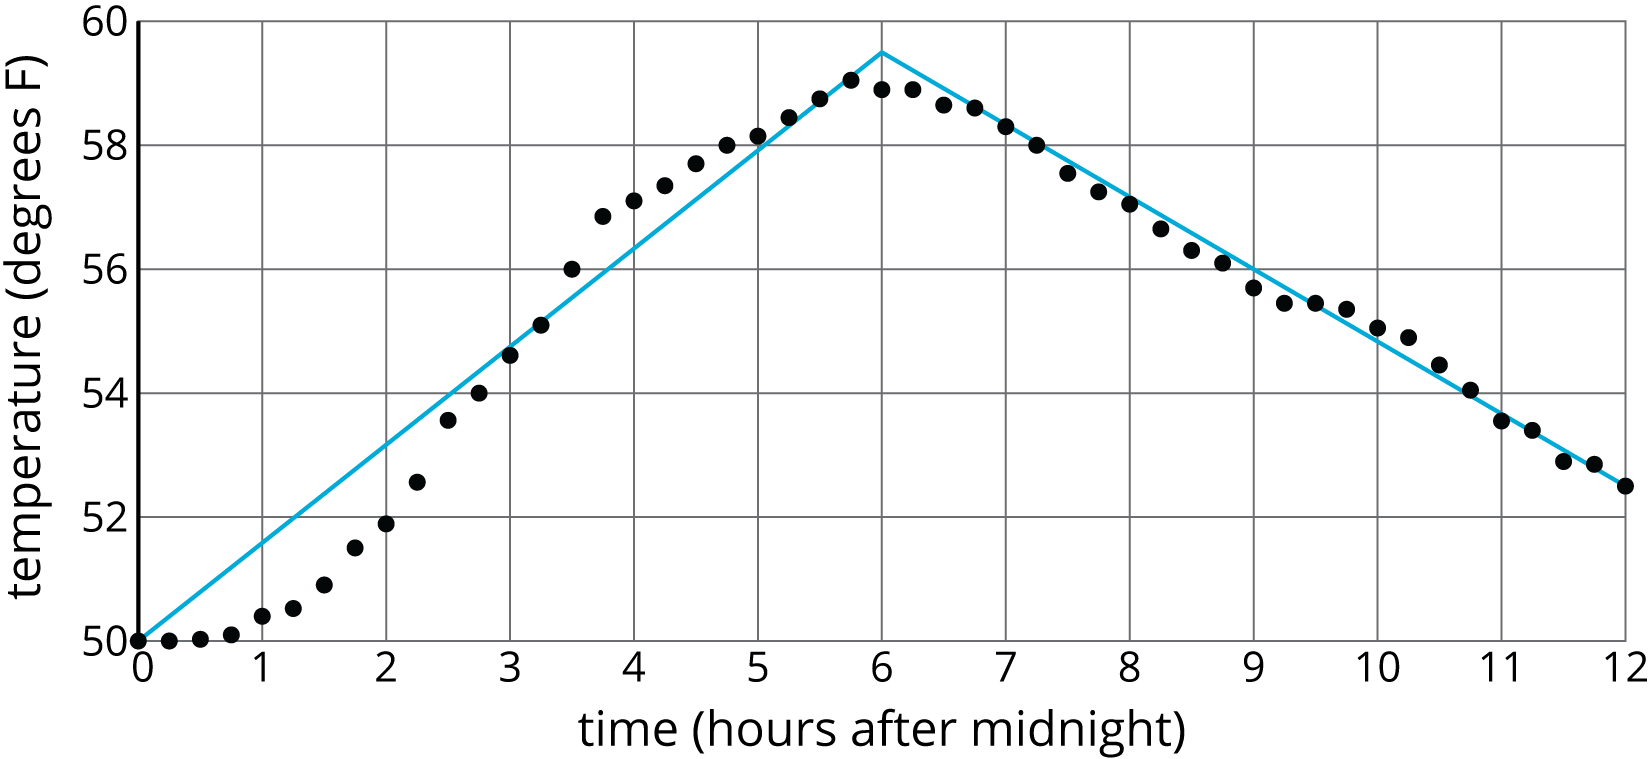
 Give students 3–5 minutes of quiet work time and then time to share their responses with their partners. Follow with a whole-class discussion.
Give students 3–5 minutes of quiet work time and then time to share their responses with their partners. Follow with a whole-class discussion.Answers
Student-Facing Task Statement
- Approximate the percentage recycled each year with a piecewise linear function by drawing between three and five line segments to approximate the graph.
- Find the slope for each piece. What do these slopes tell you?
- Answers vary. Here is a piecewise linear model of the graph using four line segments.
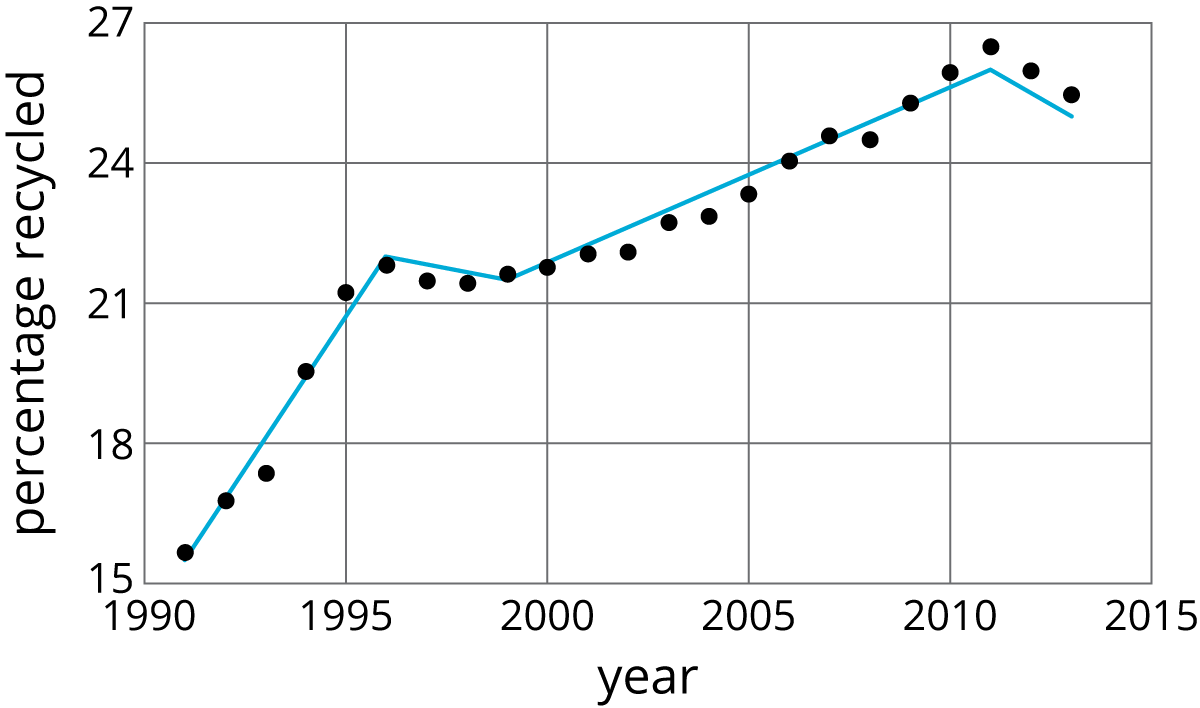
- Answers vary. The endpoints of the four segments given in the answer to the previous part are: (1991,16), (1996,22), (1999,21.5), (2011,26), and (2013,25), so we can find that the four line segments have respective slopes 65, -16, 38, and -12. These slopes describe the approximate rate at which the percent recycled increased or decreased over those times. For example, from 2011 to 2013, the percent recycled decreased by approximately 0.5 percent per year.