Google Classroom
구글 클래스룸
GeoGebra
지오지브라 클래스룸
로그인
검색
Google Classroom
구글 클래스룸
GeoGebra
지오지브라 클래스룸
개요
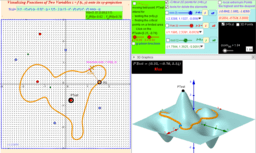
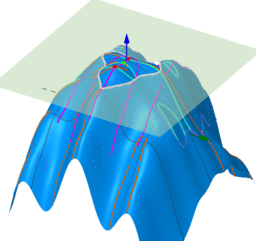
Visualizing Functions of Two Variables 1
Visualizing Functions of Two Variables
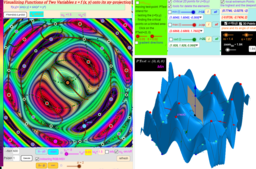
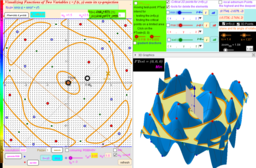
Visualizing Functions of Two Variables. Version 2
Visualizing Functions of Two Variables. Version 3
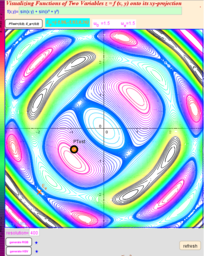
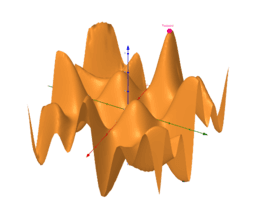
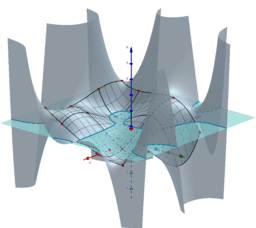
sin(x*y)+sin(x^2+y^2)- Images to Visualizing Functions of Two Variables
Visualizing Functions of Two Variables. Version 3
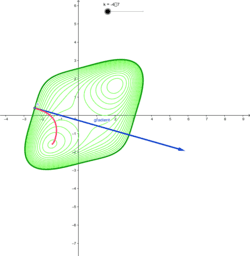
Contour Plot
Level Curves
Gradient vs. Level Curves
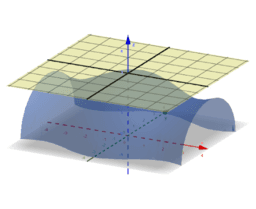
Funktion mit zwei Variablen
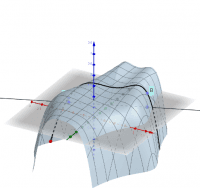
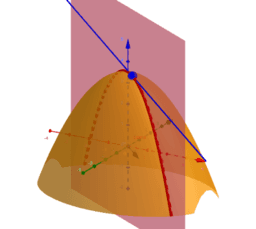
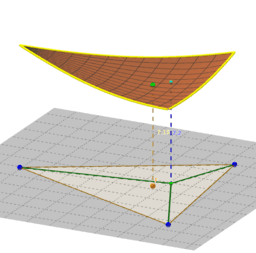
Fläche mit horizontaler Schnittebene
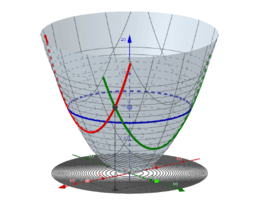
Geodäte auf einer Fläche f(x,y)
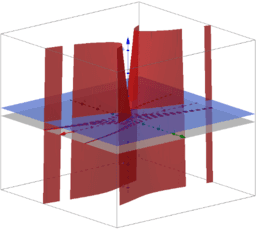
Vektorfeld eines Gradienten
勾配ベクトル場
Tribute to Hilma af Klint
Dodekaederstern
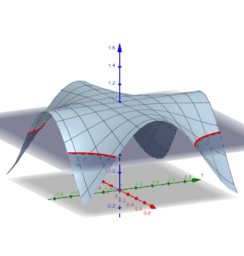
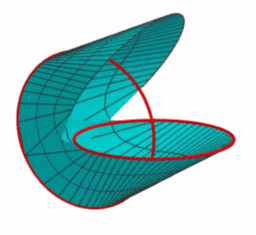
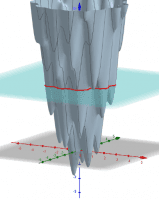
Motzkin-Fläche
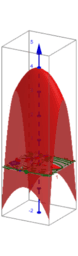
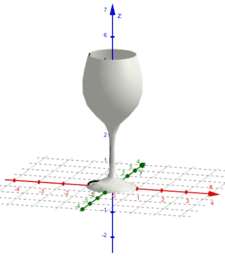
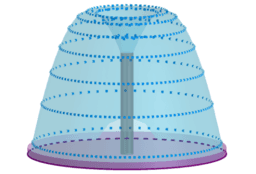
Volumen eines Weinglases
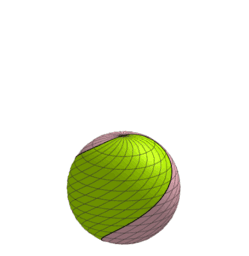
Spiral Screw Bisection of a Sphere
oloide
Directional Derivatives
Multivariable Taylor Approximation
El punt de Fermat
Modelando una Fuente
Exploring functions of 2 variables
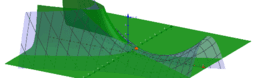
3D-Fläche mit Höhenschichtlinien
Visualizing Functions of Two Variables 1
저자:
Roman Chijner
주제:
함수
Visualizing Functions of Two Variables
Visualizing Functions of Two Variables. Version 2
Visualizing Functions of Two Variables. Version 3
sin(x*y)+sin(x^2+y^2)- Images to Visualizing Functions of Two Variables
Visualizing Functions of Two Variables. Version 3
Contour Plot
Level Curves
Gradient vs. Level Curves
Funktion mit zwei Variablen
Fläche mit horizontaler Schnittebene
Geodäte auf einer Fläche f(x,y)
Vektorfeld eines Gradienten
勾配ベクトル場
Tribute to Hilma af Klint
Dodekaederstern
Motzkin-Fläche
Volumen eines Weinglases
Spiral Screw Bisection of a Sphere
oloide
Directional Derivatives
Multivariable Taylor Approximation
El punt de Fermat
Modelando una Fuente
Exploring functions of 2 variables
3D-Fläche mit Höhenschichtlinien
다음
Visualizing Functions of Two Variables
새 자료
bewijs stelling van Pythagoras
Cartesian vs Polar
Model sferyczny - sześcian-ośmiościan
Slope Between 2 Points (Phase 2)
apec
자료 찾기
Euclid’s theorem of leg
Angle theorem
bisector
Урок_17(1)
Hyperbolic geometry
주제 찾기
좌표
매개변수곡선
산술
선분
입체도형 or 3D 도형