Buscar
GeoGebra
  • Inicio
  • Recursos
  • Perfil
  • Classroom
  • Descargas

Window 3D Grafics

Autor:Horst-Armin Kosog
Image
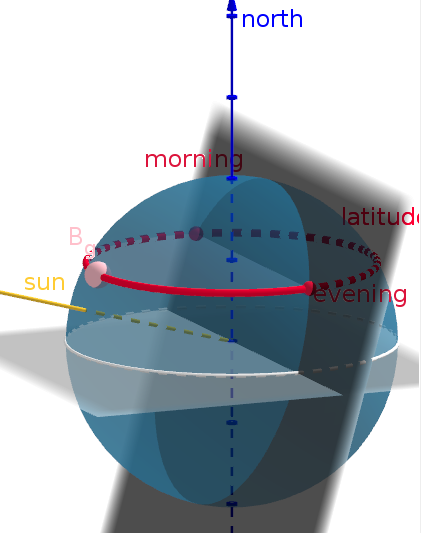
It's shown how height of sun at highnoon is changing within the seasons. In the "Graphic"-window the dato and the latitude can be chosen and animated. The rotation of the earth is visualized by rotating an observer Bg with the slider td in window "Graphics2".

Nuevos recursos

  • Zeit-Ort-Diagramm lesen und interpretieren
  • Gleitkommadarstellung - Level 2
  • Darstellungsweisen von rationalen Zahlen
  • Stelle und Funktionswert
  • Konstruieren das Inverse eines Punktes mit einem Zirkel

Descubrir recursos

  • Anwendung von Ober- und Untersumme
  • Ubahnfahrt
  • Monte-Carlo-Simulation zur Abschätzung von pi
  • Würfelschnitte
  • Punktspiegelung Einführung

Descubre temas

  • Boceto
  • Límites
  • Regresión Lineal
  • Intersección
  • Características estadísticas
InformaciónSociosCentro de ayuda
Condiciones del servicioPrivacidadLicencia
Calculadora gráficaSuite CalculadoraRecursos matemáticos

Descarga aquí nuestras aplicaciones:

Download_on_the_App_Store_Badge_US-UK_RGB_blk_4SVG_092917

© 2026 GeoGebra®