Graphing the Sine Functions - Chapter 3
Activity 1
In this activity, we will investigate the characteristics of the sine function graph.
We will investigate the in the graph of trigonometric functions due to changes in constants in functions
y = a sin (b(x+c)) + d.
Change the value of "c" using the slider!
1. Increase the value of "c" by moving the slider to the right, what changes have occurred to the graph?
2. Decrease the value of "c" by moving the slider to the left, what changes have occurred to the graph?
3. Describe the graph changes when the value of "c" is equal to 30 degree.
4. Describe the graph changes when the value of "c" is equal to -30 degree.
5. Describe the changes that occur on the graph if the value of "c" is changed.
6. Make the graph: y = sin 2(x+30) using the applet. Describe the graph changes when the value of b equals 2 and the value of c equals 30.
Change the value of "d" using the slider!
7. Describe the changes that occur on the graph if the value of "d" is changed.
Activity 2
In this activity, we will try to answer questions related to the characteristics of sine graph function.
Question 1
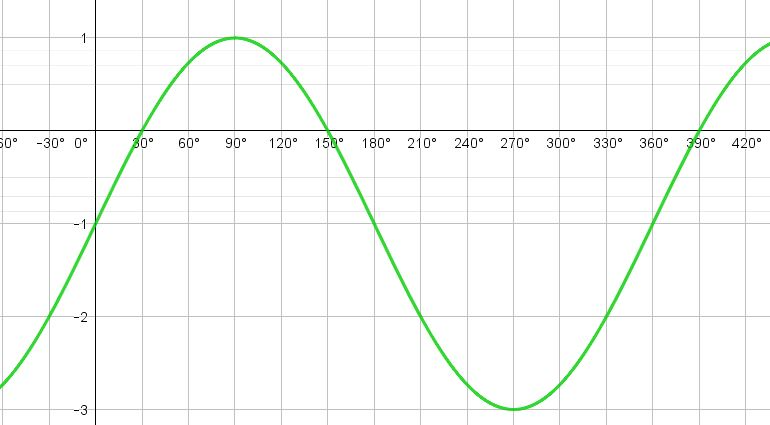
1. The graph equation on Question 1 is ...
Question 2
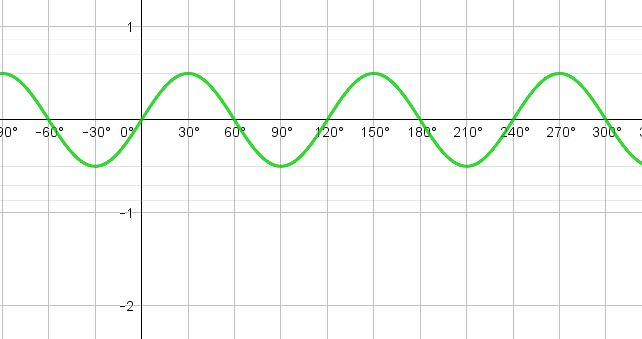
2. The graph equation on Question 2 is ....