Menggambar Grafik Fungsi Sin - Bagian 3
Aktivitas 1
Pada aktivitas ini, kita akan mengamati karakteristik grafik fungsi sin.
Kita akan mengamati perubahan yang terjadi pada grafik fungsi berdasarkan berubahan dari konstanta pada fungsi y = a sin (b(x+c)) + d.
Ubahlah nilai "c" dengan menggunakan slider!
1. Perbesar nilai "c" dengan menggeser slider ke kanan. Perubahan apa yang terjadi pada grafik?
2. Perkecil nilai "c" dengan menggeser slider ke kiri. Perubahan apa yang terjadi pada grafik?
3. Describe the graph changes when the value of "c" is equal to 30 degree.
4. Describe the graph changes when the value of "c" is equal to -30 degree.
5. Describe the changes that occur on the graph if the value of "c" is changed.
6. Make the graph: y = sin 2(x+30) using the applet. Describe the graph changes when the value of b equals 2 and the value of c equals 30.
Change the value of "d" using the slider!
7. Describe the changes that occur on the graph if the value of "d" is changed.
Activity 2
In this activity, we will try to answer questions related to the characteristics of sine graph function.
Question 1
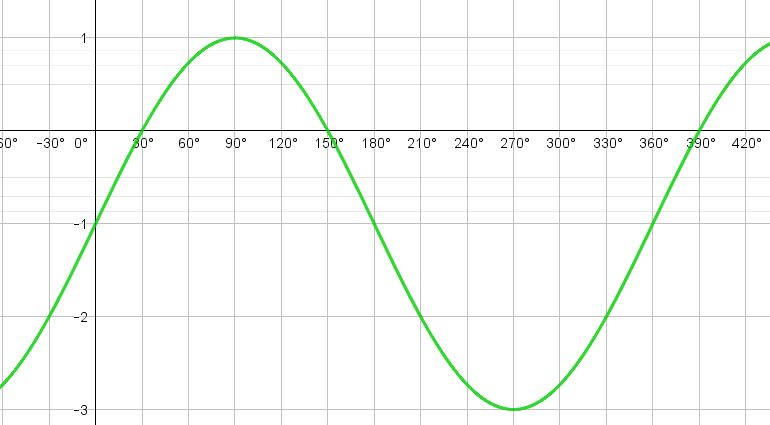
1. The graph equation on Question 1 is ...
Question 2
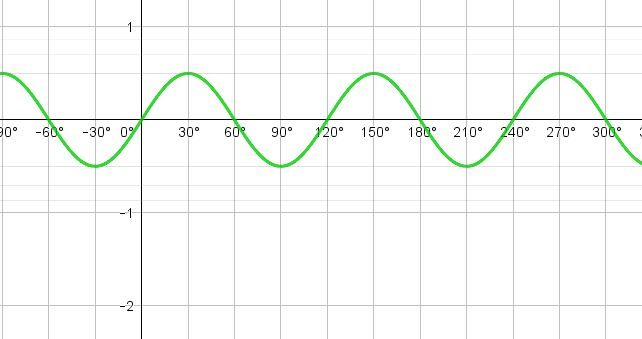
2. The graph equation on Question 2 is ....