Google Classroom
Google Classroom
GeoGebra
GeoGebra Classroom
Abrir sesión
Buscar
Google Classroom
Google Classroom
GeoGebra
GeoGebra Classroom
Esquema
Grade 8
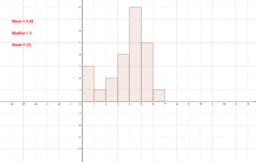
Bar graph and statistics measures
Grade 8
Autor:
Vantol Bennett
Bar graph and statistics measures
Siguiente
Bar graph and statistics measures
Nuevos recursos
Fourier Lissajous (Mechanical)
Untitled
Model sferyczny - sześcian-ośmiościan
Slope and Road Signs
apec
Descubrir recursos
x-axis rotation
Limits of Rational Functions at ± Infinity
Circle Graph Transformations
Pattern-1
hexagon
Descubre temas
Inecuaciones
Recta Tangente o Tangente
Triángulos
Cuadriláteros en general
Matrices