Search
Google ClassroomGoogle Classroom
GeoGebraGeoGebra Classroom

Outline

  1. Probability and Statistics 1.3 Representing data graphically
    1. Lesson 1.3
    2. Practice 1.3
    3. Teacher Resources 1.3

    Probability and Statistics 1.3 Representing data graphically

    Author:MEI KS3 Interactive Resources, IM 6 – 8 Math, GeoGebra Classroom Activities
    These resources have been adapted by MEI from “Representing Data Graphically” from IM Grade 6 by Open Up Resources and Illustrative Mathematics. Licensed under the Creative Commons Attribution 4.0 license.
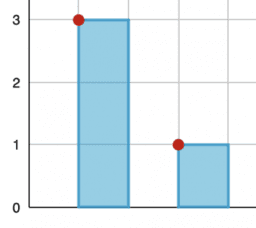
    Probability and Statistics 1.3 Representing data graphically

    Table of Contents

    • Lesson 1.3

      • Probability and Statistics 1.3 Lesson: Representing data graphically
    • Practice 1.3

      • Probability and Statistics 1.3 Practice: Representing data graphically
    • Teacher Resources 1.3

      • Probabiity and Statistics 1.3
    Next
    Probability and Statistics 1.3 Lesson: Representing data graphically

    New Resources

    • Transforming Random Variables
    • Vertical and Oblique Asymptote
    • Combining Random Variables
    • רישום חופשי
    • Tangent Vector (2)

    Discover Resources

    • P-GRAMS
    • CT4b
    • mnjj
    • Pg444 #6d
    • Ambiguous Case Law Of Sines

    Discover Topics

    • Unit Circle
    • Root
    • Vectors 3D (Three-Dimensional)
    • Boxplot
    • Matrices
    AboutPartnersHelp Centre
    Terms of ServicePrivacyLicense
    Graphing CalculatorCalculator SuiteMath Resources

    Download our apps here:

    Download_on_the_App_Store_Badge_US-UK_RGB_blk_4SVG_092917

    © 2025 GeoGebra®