Complex spiral
Description
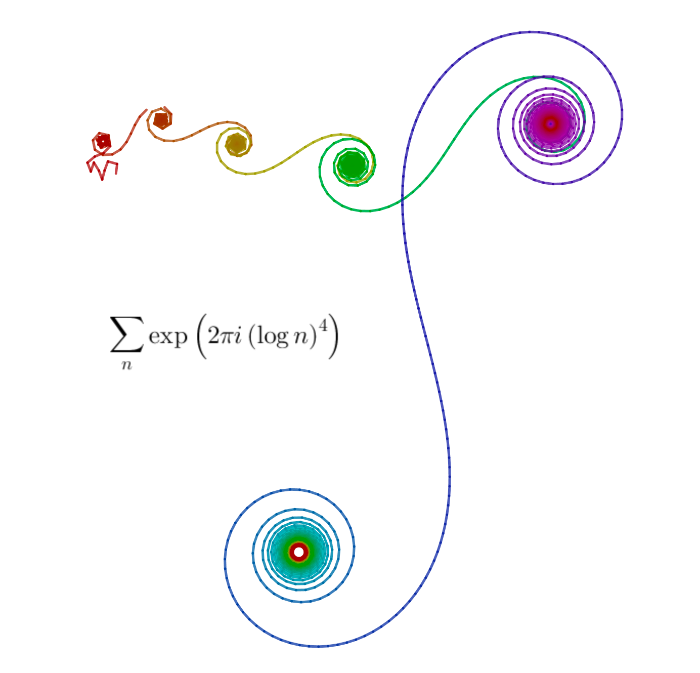
The following script plots the partial sums of a complex sequence. You need to run the script in your computer. Otherwise, will be very slow online.
GGB script
m=Slider(1, 600, 1, 1, 130, false, true, false, false)

#To plot the complete spiral, change 600 for 2400. But be careful! It gets pretty laggy

SetValue(m, 600)

L_1=Sequence( (cos( 2 * pi *( log(k)^4) ), sin(2 * pi * ( log(k)^4 )) ), k, 1, m )

SetVisibleInView(L_1, 1, false)

Execute(Sequence("A"+k+"=Sum(L_1, "+k+")", k, 1, m))

Execute(Sequence("SetVisibleInView(A"+k+", 1, false)", k, 1, m))

Execute(Sequence("B"+k+"=Segment(A"+k+", A"+(k+1)+")", k, 1, m-1))

Execute(Sequence("ShowLabel(B"+k+", false)", k, 1, m))

#Finally change the color mode to HSV and run the following

Execute(Sequence("SetDynamicColor(B"+k+", "+k+"/300, 1, 0.6)", k, 1, m))

#Enjoy
Result for m = 2400
Script II
m=Slider(1, 600, 1, 1, 130, false, true, false, false)
#To plot the complete spiral, change 600 for 2400. But be careful! It gets pretty laggy
SetValue(m, 600)
f(x) = ln(x)^(4)
Lm = 1..m
L_1 = Zip( exp( 2 * pi * ί * f(k) ), k, Lm )
SetVisibleInView(L_1, 1, false)
Execute(Zip("A"+k+"=Sum(L_1, "+k+")", k, Lm))
Execute(Zip("SetVisibleInView(A"+k+", 1, false)", k, Lm))
Execute(Zip("B"+k+"=Segment(A"+k+", A"+(k+1)+")", k, Lm))
Execute(Zip("ShowLabel(B"+k+", false)", k, Lm))
Execute(Zip("SetDynamicColor(B"+k+", "+k+"/600, 1, 0.6)", k, Lm))