Google Classroom
구글 클래스룸
GeoGebra
지오지브라 클래스룸
로그인
검색
Google Classroom
구글 클래스룸
GeoGebra
지오지브라 클래스룸
개요
Grafieken van tweedegraadsfuncties
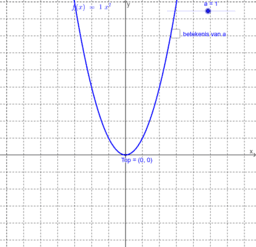
Grafiek van f(x)=ax²
Grafiek van f(x)=a(x - p)²+q
Grafieken van tweedegraadsfuncties
저자:
Sabine Van Keer
주제:
함수
,
함수 그래프
Invloed van de parameters op de grafiek van een tweedegraadsfunctie.
목차
Grafiek van f(x)=ax²
Invloed van a
De waarde van a aflezen uit de grafiek
Grafiek van f(x)=a(x - p)²+q
Grafiek van functies f(x) = a (x-p)²
Grafiek van f(x)=ax²+q
Grafiek van functies f(x)=a(x-p)²+q
다음
Invloed van a
새 자료
kosmologie met goddelijke proportie
Burana toren (Kirgizië)
twee figuren met dezelfde oppervlakte
dodecaëder met gaten
eigenschappen van een rechthoek
자료 찾기
Volume van een kegel.
lemniscaat
Gekleurde_parabolen
oef_4gon_1tangensrico2
X(1162) Outer Grebe-orthic perspector
주제 찾기
이항분포
비율
수
대수
입체도형 or 3D 도형