Google Classroom
Google Classroom
GeoGebra
GeoGebra Classroom
Abrir sesión
Buscar
Google Classroom
Google Classroom
GeoGebra
GeoGebra Classroom
Esquema
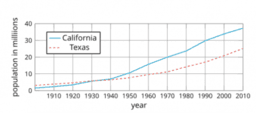
Using Graphs to Find Average Rate of Change: IM Alg1.4.7
Alg1.4.7 Lesson
Alg1.4.7 Practice
Using Graphs to Find Average Rate of Change: IM Alg1.4.7
Autor:
GeoGebra Classroom Activities
Tema:
Álgebra
,
Estadística
“Using Graphs to Find Average Rate of Change”
from IM Algebra I © 2019
Illustrative Mathematics
. Licensed under the
Creative Commons Attribution 4.0
license.
Tabla de contenidos
Alg1.4.7 Lesson
IM Alg1.4.7 Lesson: Using Graphs to Find Average Rate of Change
Alg1.4.7 Practice
IM Alg1.4.7 Practice: Using Graphs to Find Average Rate of Change
Siguiente
IM Alg1.4.7 Lesson: Using Graphs to Find Average Rate of Change
Nuevos recursos
Model sferyczny - sześcian-ośmiościan
גיליון אלקטרוני להעלאת נתוני בעיה ויצירת גרף בהתאם
Angle Addition: Warm Up Exercises
z`]]
Rose Curve
Descubrir recursos
symmetry/transformations
Line Bisector
vidojj game keith
Projectile, Vertical, Horizontal Motion
System of Linear Equations Example
Descubre temas
Distribuciones
Razones
Distribución normal
Enteros
Elipse