Graphing the Sine Functions - Chapter 1
Activity 1
In this activity, we will investigate the characteristics of the sine function graph.
We will investigate the in the graph of trigonometric functions due to changes in constants in functions
y = a sin (b(x+c)) + d.
In this chapter, we will focus on the change of constant "a".
Change the value of "a" using the slider!
1. Change the value of "a" to 2 and 3, describe how the graph is change.
2. Change the value of "a" to 1/2, describe how the graph is change.
3. Change the value of "a" to -1, describe how the graph is change.
4. Describe the changes that occur on the graph if the value of "a" is changed.
5. Do you still remember about "amplitude" of a sine graph? Is there any relationship between the value of "a" and the "amplitude" of the graph?
6. Describe the amplitude change when the value of "a" become negative.
Activity 2
In this activity, we will try to answer questions related to the characteristics of sine graph function.
Question 1
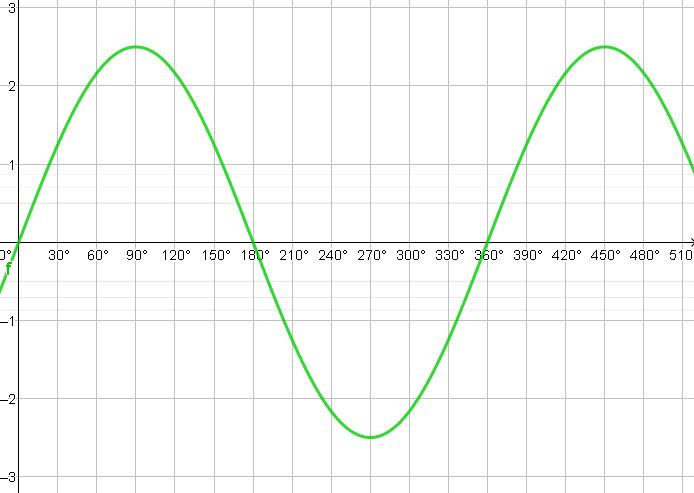
1. Please observe the graph y = k sin ax on Question 1. The value of k for this graph is ….
Question 2
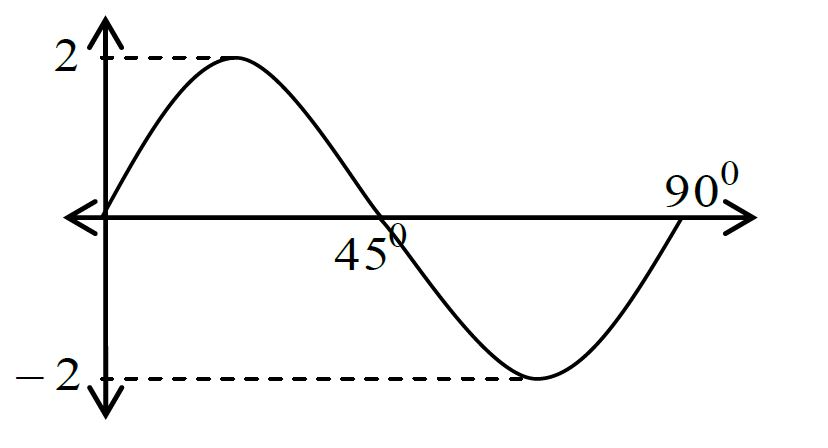
2. The value of "a" on the graph of f(x) = a sin x on Question 2 is ….
Question 3
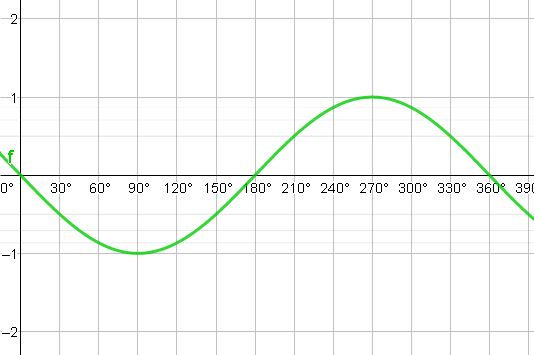
3. On the Question 3, f(x) = ....