Outline
Grade 7_Quarter 3- Data
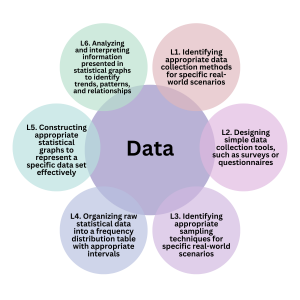
Table of Contents
Lesson 3. Identifying appropriate sampling techniques for specific real-world scenarios
Lesson 4. Organizing raw statistical data into a frequency distribution table with appropriate intervals
Lesson 5. Constructing appropriate statistical graphs to represent a specific data set effectively
- Activity 5.1 Constructing a Pie Graph
- Activity 5.2 Construct a Bar Graph
- Activity 5.3 Construct a Line Graph
- Constructing a Bar Graph (with an option to choose number of bars/categories)
- Activity 5.5 Construct Pie Graph (with option to choose number of categories)
- Lesson 5.6 Construct Bar Graph and Frequency Table (with option to choose number of bars/categories)
- Activity 5.7 Construct Pie and Bar Graph with Frequency Table (with option to choose number of categories)
Lesson 6. Analyzing and interpreting information presented in statistical graphs to identify trends, patterns, and relationships