Graphing the Sine Functions - Chapter 2
Activity 1
In this activity, we will investigate the characteristics of the sine function graph.
We will investigate the in the graph of trigonometric functions due to changes in constants in functions
y = a sin (b(x+c)) + d.
We will continue to see the graph changes when we change the value of "a" and "b".
1. On the previous chapter, do you still remember the relationship between the value of "a" and the "amplitude" of the graph? Please explain.
Change the value of "b" using the slider!
2. Change the value of "b" to 2 and 3, describe how the graph is change.
3. Change the value of "b" to 1/2 and 3, describe how the graph is change.
4. Describe the changes that occur on the graph if the value of "b" is changed.
5. Do you still remember about the sine graph period? Is there any relationship between the change of "b" and the graph period?
Activity 2
In this activity, we will try to answer questions related to the characteristics of sine graph function.
Question 1
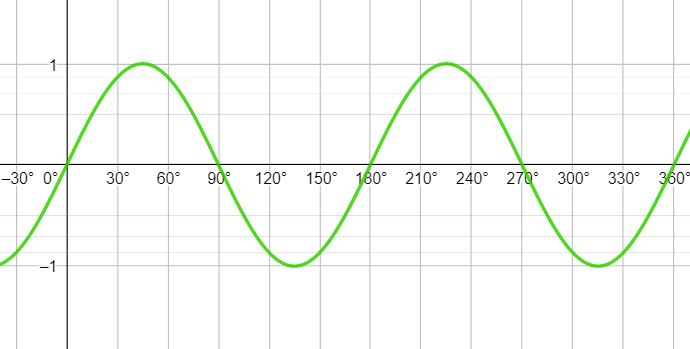
The value of b on the Question 1 graph: y = a sin bx is ....
Question 2
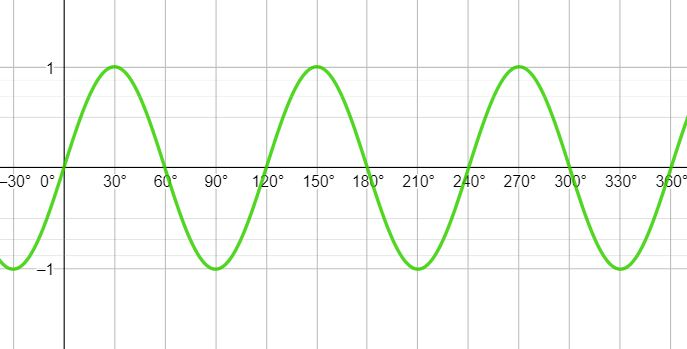
The value of a and b on the Question 2 graph: y = a sin bx are ....
Question 3
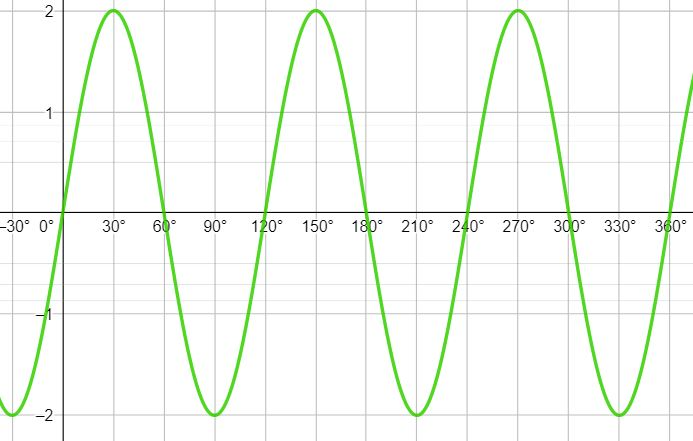
The equation of the Question 3 graph is ....
Question 4
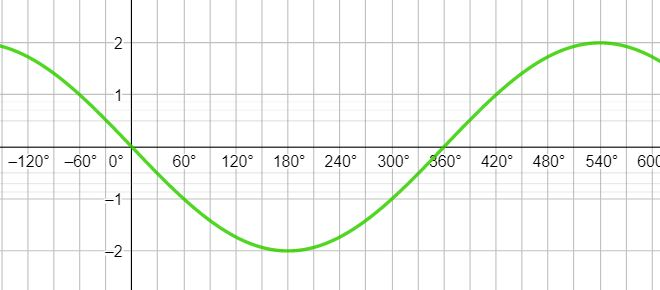
Describe the equation of the Question 4 graph. Explain your answer!