Google Classroom
Google Classroom
GeoGebra
GeoGebra Classroom
Sign in
Search
Google Classroom
Google Classroom
GeoGebra
GeoGebra Classroom
Outline
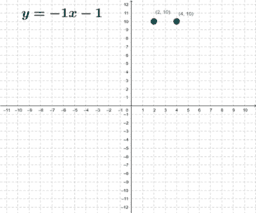
Graphing Lines y=mx+b
Graph the Line
Slope Intercept Form
Graphing Lines y=mx+b
Author:
Szotákné Tóth Márta
,
Brack Herald
Dragging a line to represent slope and y-intercept
Graph the Line
Slope Intercept Form
Next
Graph the Line
New Resources
bewijs stelling van Pythagoras
Some random function
Untitled
apec
Viviani's Curve
Discover Resources
Animation 53
H Rectangle Const
triangle
Segment Addition Postulate
tools
Discover Topics
Polygons
Pythagoras or Pythagorean Theorem
Matrices
Square
Mathematics