Google Classroom
Google Classroom
GeoGebra
GeoGebra Classroom
Abrir sesión
Buscar
Google Classroom
Google Classroom
GeoGebra
GeoGebra Classroom
Esquema
Average Value
Morph Average Value v1
Morph Average Value v2
Morph Average Value v3
MVT Intro Applet
Average Value
Autor:
Jason Slowbe
Tema:
Cálculo
,
Cálculo integral
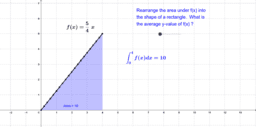
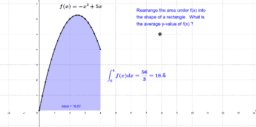
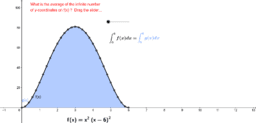
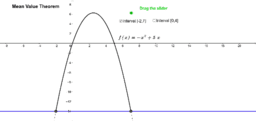
Morphing the area under a function to graphically represent its average y-value. Animating the Mean Value Theorem for slopes on an interval.
Morph Average Value v1
Morph Average Value v2
Morph Average Value v3
MVT Intro Applet
Siguiente
Morph Average Value v1
Nuevos recursos
Cartesian vs Polar
Slope and Road Signs
Some random function
z`]]
Model sferyczny - sześcian-ośmiościan
Descubrir recursos
triangle
Modul 14C_KASIATI_SMP ISLAM MA'ARIF 02 KOTA MALANG
Krug i kružnica
gradient
india-tax-2020
Descubre temas
Test de hipótesis
Segmento Mediana
Cono
Integral Indefinida
Ortocentro