Google Classroom
Google Classroom
GeoGebra
Aula GeoGebra
Valideu-vos
Cerca
Google Classroom
Google Classroom
GeoGebra
Aula GeoGebra
Esbós
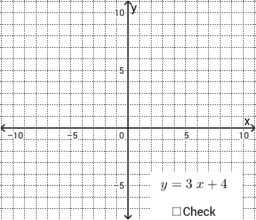
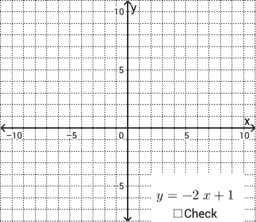
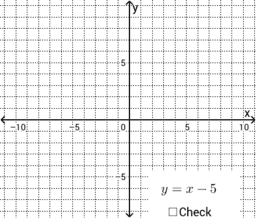
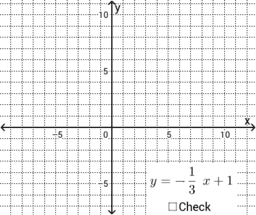
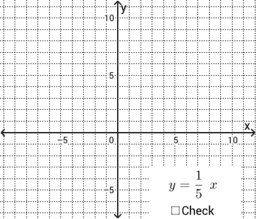
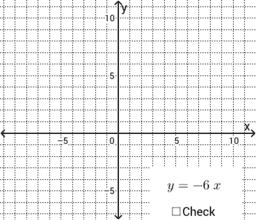
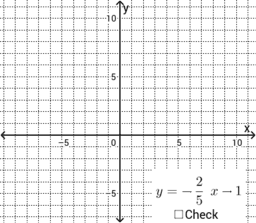
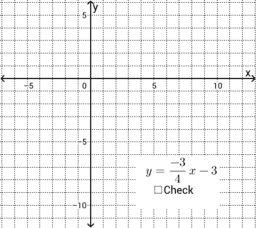
Graphing Lines with y=mx+b
a
b
c
d
e
f
g
h
Make Your Own Graph
Graphing Lines with y=mx+b
Autor:
Brett Bellaire
a
b
c
d
e
f
g
h
Make Your Own Graph
Següent
a
Nous materials
Fourier Lissajous (Mechanical)
အခြေခံ data အခေါ်အဝေါ်များ
z`]]
Trefoil Knot
Slope and Road Signs
Descobriu materials
complex number subtraction
MTH 408
Untitled
Skeletal Octahedron
Descobriu Temes
Funcions polinòmiques
Funció Tangent
Números
Àlgebra
Equacions