Google Classroom
Google Classroom
GeoGebra
GeoGebra Classroom
Bejelentkezés
Keres
Google Classroom
Google Classroom
GeoGebra
GeoGebra Classroom
Áttekintés
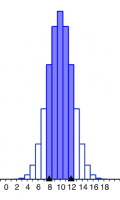
Hypothesis Testing Apps
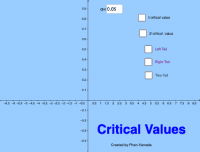
Critical Values
Graphing Different Confidence Intervals
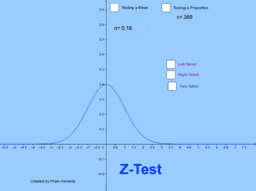
Z-test for Mean and Proportion
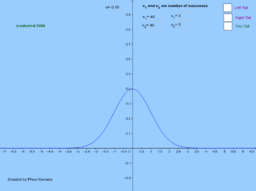
z-test for Two Different Proportions
t-test for one mean
t-test for two means
Stat Calculator
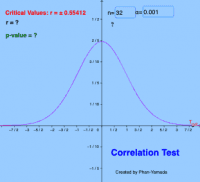
Correlation Coefficient t-test
Percentile with a data set
Hypothesis Testing Apps
Szerző:
Tuyetdong Phan-Yamada
Critical Values
Graphing Different Confidence Intervals
Z-test for Mean and Proportion
z-test for Two Different Proportions
t-test for one mean
t-test for two means
Stat Calculator
Correlation Coefficient t-test
Percentile with a data set
Következő
Critical Values
Új anyagok
z`]]
Slope and Road Signs
Trefoil Knot
Model sferyczny - dwunastościan-dwudziestościan
seo tool
Anyagok felfedezése
Simetría
Angle Bisectors
Whats your sin?
Tina's graph of fun
Koser Medians
Témák felfedezése
Integrálszámítás
Oszlopdiagram
Határozatlan integrál
Exponenciális függvény
Terület