Google Classroom
Google Classroom
GeoGebra
GeoGebra Classroom
Accedi
Cerca
Google Classroom
Google Classroom
GeoGebra
GeoGebra Classroom
Contenuti
Statistics Step Through Applets
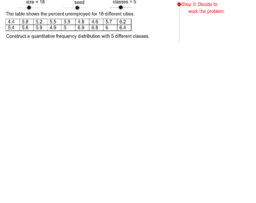
Step Through Quantitative Freq. Dist. Construction
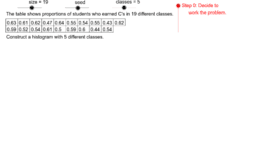
Step Through Histogram Construction
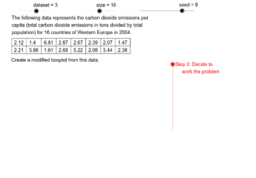
Step Through Modified Boxplot Construction
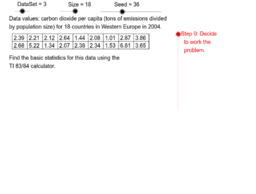
Step Through Basic Statistics with TI 83/84 Calculator
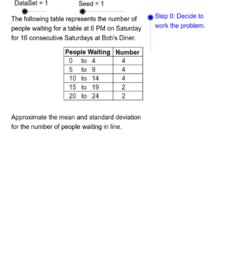
Step Through Mean & Standard Deviation of Grouped Data
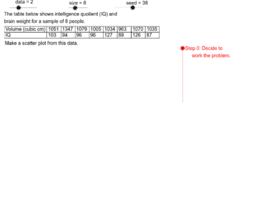
Step Through Scatter Plot Construction
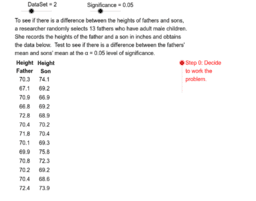
Step Through Dependent Difference Test
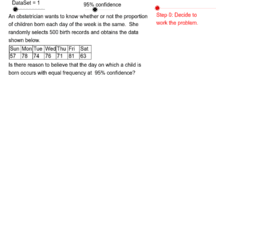
Step Through Goodness of Fit Test
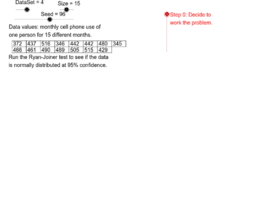
Step Through Ryan-Joiner Test
Statistics Step Through Applets
Autore:
David Gurney
Argomento:
Statistica
These applets show the steps involved in doing some standard procedures of elementary statistics.
Step Through Quantitative Freq. Dist. Construction
Step Through Histogram Construction
Step Through Modified Boxplot Construction
Step Through Basic Statistics with TI 83/84 Calculator
Step Through Mean & Standard Deviation of Grouped Data
Step Through Scatter Plot Construction
Step Through Dependent Difference Test
Step Through Goodness of Fit Test
Step Through Ryan-Joiner Test
Successivo
Step Through Quantitative Freq. Dist. Construction
Nuove risorse
Damped Trochoidal Curve
Untitled
רישום חופשי
Random Polar Curve (3)
גיליון אלקטרוני להעלאת נתוני בעיה ויצירת גרף בהתאם
Scopri le risorse
Asintotas
S_PRECA_U2_L8_CE_Test9_V2
(P9/Q2) Pole and Shadow
Rosace de losanges
Exercise 1.2.1 Christine McManus
Scopri gli argomenti
Parallelepipedo
Intersezioni
Punti speciali
Numeri naturali
Coordinate