Anmelden
Suche
GeoGebra
Startseite
Materialien
Profil
Classroom
Apps herunterladen
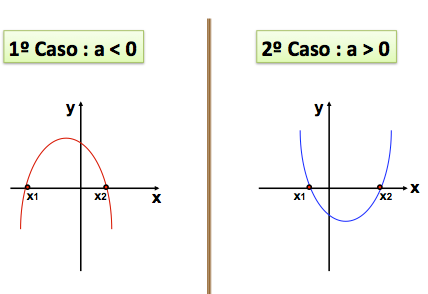
Definição e exemplos de gráficos
Autor:
Laísa e Antônio
O gráfico de uma função quadrática é representado por uma curva, à qual denomina-se parábola. Atribui-se valores para x e y e depois organiza-se eles no gráfico.
Neue Materialien
Questão UERJ 2022
Icosaedro
cuboesfera
Mondrian (Puzzle)
teste_aula151024
Entdecke Materialien
r hor obl reb
Circulo trigonometrico
Material parte 2
Material 22
Jogo do Camaleão II
Entdecke weitere Themen
Abschnittsweise definierte Funktionen
Tangente
Statistik
Analysis
Verhältnisse