GeoGebra
  • Home
  • News Feed
  • Resources
  • Profile
  • People
  • Groups
  • App Downloads
About GeoGebra
Contact us: office@geogebra.org
Terms of Service – Privacy – License
Language: English

© 2018 GeoGebra

GeoGebra

Funktionsgleichung - Wertetabelle - Graph

Author:
Frank Schumann
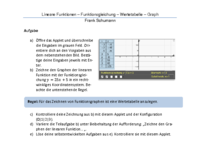
Nach Eingabe von Funktionsterm, Startzahl und Schrittweite werden berechnet und angezeigt: - Wertetabelle - Liste von Graphen-Punkten - Funktionsgraph - Nullstellen (nur bei Polynomfunktion) - ein Extremum (nur bei Polynomfunktion).
GeoGebra Applet
Klicke in die Kontrollkästchen. Ediere: Funktionsterm, Startzahl und Schrittweite. Ziehe am Graphen. Für einen Neustart drücke die Taste F5.

Funktionsgleichung – Wertetabelle – Graph

Funktionsgleichung – Wertetabelle – Graph.pdf

Funktionsgleichung – Wertetabelle – Graph.pdf

Image

New Resources

  • Energieerhaltung4
  • Innenwinkelsumme
  • W5_116_5
  • W5 116_4a
  • Energieerhaltung3

Discover Resources

  • Primzahltabelle in 30er-Spalten
  • LU 15 "Kosten berechnen" pro Sandwich
  • Parameter einer Polynomfunktion 3. Grades
  • Lösung Mathe Test M3H16A
  • Transformation of Cylinder

Discover Topics

  • Geometric Mean
  • Angles
  • Circle
  • Indefinite Integral
  • Statistics

GeoGebra

  • About
  • Team
  • News Feed
  • Partners

Apps

  • Graphing Calculator
  • Geometry
  • 3D Graphing
  • App Downloads

Resources

  • Classroom Resources
  • Groups
  • Tutorials
  • Help
  • Language: English
  • Terms of Service Privacy License
  • Facebook Twitter YouTube