Google Classroom
Google Classroom
GeoGebra
GeoGebra Classroom
Abrir sesión
Buscar
Google Classroom
Google Classroom
GeoGebra
GeoGebra Classroom
Esquema
AP Statistics
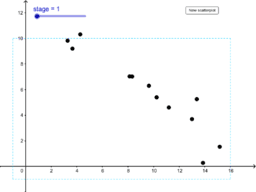
Draw line of best fit
AP Statistics
Autor:
Lee Brown
Tema:
Estadística
Draw line of best fit
Siguiente
Draw line of best fit
Nuevos recursos
Fourier Lissajous (Mechanical)
רישום חופשי
Viviani's Curve
Angle Addition: Warm Up Exercises
z`]]
Descubrir recursos
Transforming the Absolute Value Parent Function
experimento 3 - volume do paralelepípedo
สมการเชิงเส้นสองตัวแปล
Mandelbrot Set
The stellated rhombic dodecahedron
Descubre temas
Prisma
Límites
Diagramas
Cilindro
Hipérbola