Google Classroom
Google Classroom
GeoGebra
GeoGebra Classroom
Accedi
Cerca
Google Classroom
Google Classroom
GeoGebra
GeoGebra Classroom
Contenuti
Beschrijvende statistiek
pg. 64 oef. 27
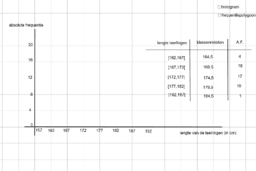
histogram en frequentiepolygoon pg. 8
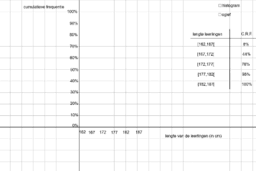
histogram en ogief pg. 9
Beschrijvende statistiek
Autore:
Isabel Kreijkamp
Argomento:
Statistica
pg. 64 oef. 27
histogram en frequentiepolygoon pg. 8
histogram en ogief pg. 9
Successivo
pg. 64 oef. 27
Nuove risorse
De volledige 13 boeken van Euclides' Elementen
oef: rekenlabyrint
limieten en uitgebreide getallenverzameling
een lijnstuk verdelen in uiterste en middelste reden
eigenschappen van een rechthoek
Scopri le risorse
M1 WI H03 1-6
Rechte lijn
cilinder
Opdracht Kwadratische Formule vinden
oef: groter, kleiner of gelijk?
Scopri gli argomenti
Matrici
Triangoli simili
Figure o forme piane
Numeri razionali
Problemi di ottimizzazione