Google Classroom
Google Classroom
GeoGebra
GeoGebra Lesson
Anmelden
Suche
Google Classroom
Google Classroom
GeoGebra
GeoGebra Lesson
Kapitel
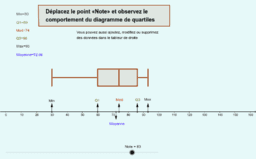
Diagramme de quartile
Mesures de tendance centrale
Diagramme de quartile
Autor:
Julie Miller
Mesures de tendance centrale
Weiter
Mesures de tendance centrale
Neue Materialien
activité1 27-01
Test d'outil pour trouver les termes de certains polynômes.
Flocon de Koch 241026
Chronomètre en secondes.
Pain au levain.
Entdecke Materialien
Devoir Maison - 1ère S
Lignes de champ d'un aimant droit
Fonction exponentielle
althabet : les animations cotoient les cours !
Cours 1 : La fonction carré
Entdecke weitere Themen
Differentialgleichungen
Fläche
Balkendiagramm oder Säulendiagramm
Extremwertaufgaben oder Extremwertprobleme
Graph