Google Classroom
Google Classroom
GeoGebra
Classe GeoGebra
Se connecter
Chercher
Google Classroom
Google Classroom
GeoGebra
Classe GeoGebra
Contenu
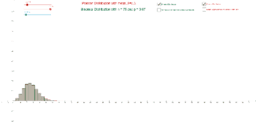
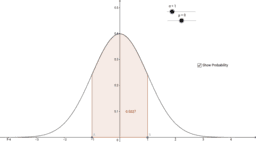
Standard Deviation Graphs
Poisson Distribution vs.Binomial Distribution
Altering the standard deviation and mean of the normal curve
Standard Deviation Graphs
Auteur :
John Snel
Poisson Distribution vs.Binomial Distribution
Altering the standard deviation and mean of the normal curve
Suivant
Poisson Distribution vs.Binomial Distribution
Nouvelles ressources
גיליון אלקטרוני להעלאת נתוני בעיה ויצירת גרף בהתאם
Damped Trochoidal Curve
Slope Between 2 Points (Phase 2)
seo tool
Untitled
Découvrir des ressources
Adventureland Task p4
basketball parabolic motion shimkent bill boys
אזרלו משימה ליונג
AREA ROMBOIDE O PARALLELOGRAMMA
Découvrir des Thèmes
Fonctions Logarithmiques
Loi Normale
Calcul Intégral
Ellipse
Pyramide