Lesson 4 Quadratic Inequalities part ii
Introduction
In the previous lesson, we saw how we could use a graph to make comparisons between two functions, one of which being quadratic, by finding the points of intersection.
It is not always practical to plot accurate graphs of functions, particularly when the points of intersection are non-integer. Sometimes it will be necessary to rearrange our inequality so that we can draw comparisons with the line y=0 (the -intercepts) since the co-ordinates here are obtainable by finding the roots of the equation.
It is important to note that the general shape of a quadratic changes depending on whether the co-efficient of is positive or negative.

Using the quadratic formula calculator to find the x-intercepts of your graph
To help you find the -intercepts (roots) of your quadratic function, you may wish to use the quadratic calculator. You should enter the values for a, b and c where your function is in the form:
Example
If we look at the example from last lesson: , rather than solve by plotting both functions, lets rearrange the inequality using inverse operations so that we are looking to find where:
.
I can now produce a sketch of the general shape of the parabola, and by finding the solutions either by factorising, using the quadratic formula, or using the calculator above I am now able to label my
-intercepts.
 So my roughly sketched graph would look like this:
 and I can easily identify for which region the quadratic is below the line , it is, as we previously found, all values of , -4<<0
So my roughly sketched graph would look like this:
and I can easily identify for which region the quadratic is below the line , it is, as we previously found, all values of , -4<<0Task
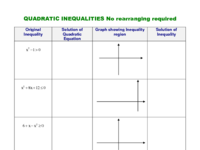
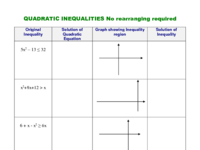
There are two different worksheets for this task, depending on whether or not you are able to rearrange using inverse operations. If you have not learnt this skill yet, please complete the task which does not require you to do so.