Google Classroom
Google Classroom
GeoGebra
GeoGebra Classroom
Abrir sesión
Buscar
Google Classroom
Google Classroom
GeoGebra
GeoGebra Classroom
Esquema
Simple Statistical Graphs
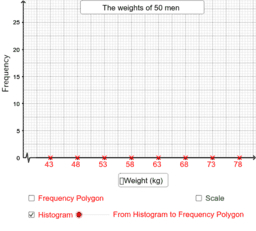
From Histograms to Frequency Polygons
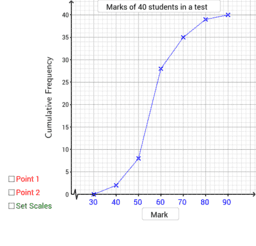
Cumulative Frequency Polygon
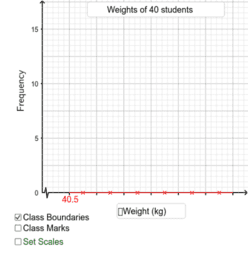
Drawing Histograms
Simple Statistical Graphs
Autor:
Alexander Lau
From Histograms to Frequency Polygons
Cumulative Frequency Polygon
Drawing Histograms
Siguiente
From Histograms to Frequency Polygons
Nuevos recursos
Slope Between 2 Points (Phase 2)
Model sferyczny - sześcian-ośmiościan
רישום חופשי
Rose Curve
Fourier Lissajous (Mechanical)
Descubrir recursos
Euler 2
balloon
ButlerL1.ggb
HKDSE 12 (B)
Construction of ellipse, second method
Utility Pole
Descubre temas
Planos
Cálculo integral
Cuadriláteros
Sustracción
Curvas paramétricas