Google Classroom
Google Classroom
GeoGebra
Classe GeoGebra
Se connecter
Chercher
Google Classroom
Google Classroom
GeoGebra
Classe GeoGebra
Contenu
Seventh PAP Math
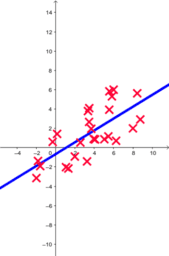
Basic scatterplot
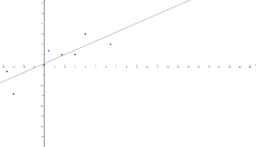
Line of best fit visual
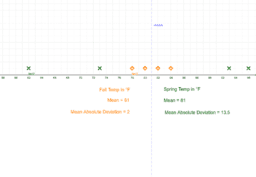
Mean Absolute Deviation
random data-1
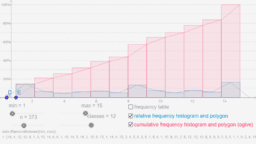
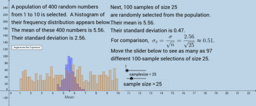
The Sampling Distribution
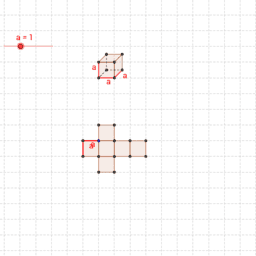
surface area of a cube / Oberfläche eines Würfels
Seventh PAP Math
Auteur :
Shulanda Wade
Basic scatterplot
Line of best fit visual
Mean Absolute Deviation
random data-1
The Sampling Distribution
surface area of a cube / Oberfläche eines Würfels
Suivant
Basic scatterplot
Nouvelles ressources
Model sferyczny - dwunastościan-dwudziestościan
Some random function
Rose Curve
Model sferyczny - sześcian-ośmiościan
Viviani's Curve
Découvrir des ressources
Proposição 3 (01)
Trekant
I totally didnt drown in the ocean (tm ben bean)
Quadratic Coefficients
สมการเส้นตรง
Découvrir des Thèmes
Symétrie
Valeur Attendue
Soustraction
Histogramme
Similitude