Google Classroom
Google Classroom
GeoGebra
GeoGebra Classroom
Abrir sesión
Buscar
Google Classroom
Google Classroom
GeoGebra
GeoGebra Classroom
Esquema
Statistics
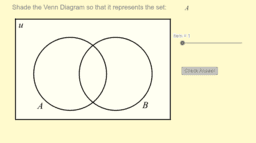
Sets and Venn Diagrams (2 Sets)
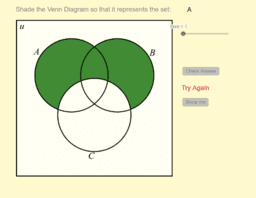
Venn Diagram (3 Sets)
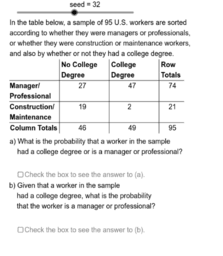
Computing Probabilities from Tables
Statistics
Autor:
Kevin Moore
Sets and Venn Diagrams (2 Sets)
Venn Diagram (3 Sets)
Computing Probabilities from Tables
Siguiente
Sets and Venn Diagrams (2 Sets)
Nuevos recursos
Viviani's Curve
Nikmati Keunggulan Di Bandar Judi Terpercaya
Slope Between 2 Points (Phase 2)
גיליון אלקטרוני להעלאת נתוני בעיה ויצירת גרף בהתאם
¿Quién llegará más lejos en el mundial?
Descubrir recursos
GGML3.1_1
Veelvlakken creëren door spiegelingen
Boys_and_Girls
Translation of a Triangle
משפט פיתגורס
Descubre temas
Gráfico de Barras
Volumen
Fracciones
Vectores 3D (tres dimensiones)
Baricentro