Google Classroom
Google Classroom
GeoGebra
GeoGebra Classroom
Sign in
Search
Google Classroom
Google Classroom
GeoGebra
GeoGebra Classroom
Outline
Graphing
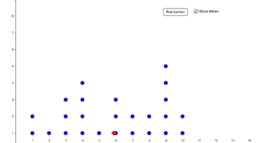
Dot Plot Generator
Graphing
Author:
Desiree.Ippolito
Dot Plot Generator
Next
Dot Plot Generator
New Resources
רישום חופשי
Random Polar Curve (3)
גיליון אלקטרוני להעלאת נתוני בעיה ויצירת גרף בהתאם
Slope Between 2 Points (Phase 2)
Cartesian vs Polar
Discover Resources
GeoGebra 1
Overview
thales teoremi
zezo12345
Transformations Lab
Value of e and why we love it
Discover Topics
Rhombus
Hyperbola
Volume
Derivative
Limits