Google Classroom
Google Classroom
GeoGebra
GeoGebra Classroom
Zaloguj się
Szukaj
Google Classroom
Google Classroom
GeoGebra
GeoGebra Classroom
Zarys
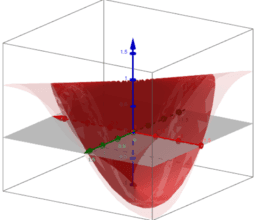
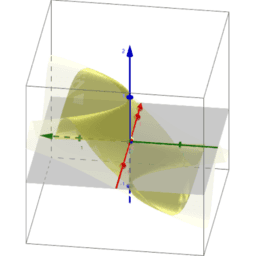
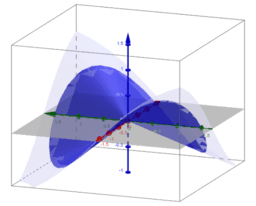
Visualization of limits of functions of two variables
Introduction
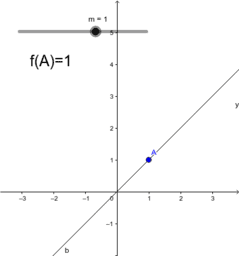
Example 1
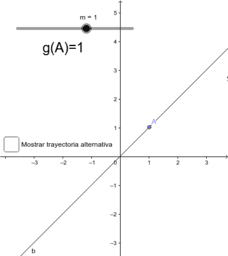
Example 2
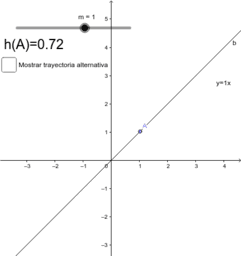
Example 3
Polar coordinates: Example 1
Polar coordinates: Example 2
Polar coordinates: Example 3
Thank you very much
Visualization of limits of functions of two variables
Autor:
Laura del Río
Temat:
Funkcje
Presentation for sharing at the GeoGebra Global Gathering 2017
Introduction
Example 1
Example 2
Example 3
Polar coordinates: Example 1
Polar coordinates: Example 2
Polar coordinates: Example 3
Thank you very much
Następny
Introduction
Nowe zasoby
Hyperbolic Paraboloid
အခြေခံ data အခေါ်အဝေါ်များ
Some random function
גיליון אלקטרוני להעלאת נתוני בעיה ויצירת גרף בהתאם
Cartesian vs Polar
Odkryj zasoby
Koch Snowflake 2
CuatroCirculos
chAD
Test Yourself: PEDMAS / BIDMAS
AA Similarity Theorem
Odkryj tematy
Conic Sections
Nierówności
Obwód
Równoległobok
Równania