Google Classroom
구글 클래스룸
GeoGebra
지오지브라 클래스룸
로그인
검색
Google Classroom
구글 클래스룸
GeoGebra
지오지브라 클래스룸
개요
Demo
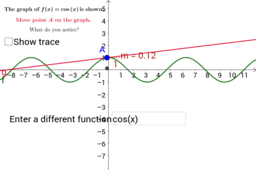
Visualize the graph of the derivative of a given function
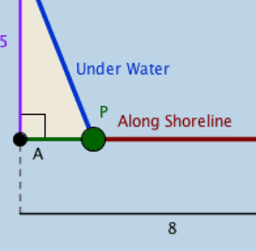
Oil Pipeline Optimization Problem
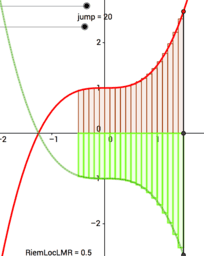
C0702 Volume Disk Method 3D Visual
Demo
저자:
Miriam Ramirez
Visualize the graph of the derivative of a given function
Oil Pipeline Optimization Problem
C0702 Volume Disk Method 3D Visual
다음
Visualize the graph of the derivative of a given function
새 자료
גיליון אלקטרוני להעלאת נתוני בעיה ויצירת גרף בהתאם
z`]]
အခြေခံ data အခေါ်အဝေါ်များ
Trefoil Knot
Rose Curve
자료 찾기
Dan's Triangle
Theorems 30-36
math
การบวกจำนวนเต็มบวกกับจำนวนเต็มลบ
주제 찾기
매개변수곡선
이항분포
각기둥
히스토그램
삼각법