Google Classroom
Google Classroom
GeoGebra
GeoGebra Classroom
Log ind
Søg
Google Classroom
Google Classroom
GeoGebra
GeoGebra Classroom
Opsummering
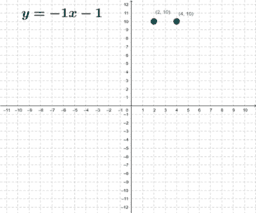
Graphing Lines y=mx+b
Graph the Line
Slope Intercept Form
Graphing Lines y=mx+b
Forfatter
Brack Herald
Dragging a line to represent slope and y-intercept
Graph the Line
Slope Intercept Form
Næste
Graph the Line
Nye Materialer
גיליון אלקטרוני להעלאת נתוני בעיה ויצירת גרף בהתאם
Model sferyczny - sześcian-ośmiościan
Slope and Road Signs
Some random function
Damped Trochoidal Curve
Opdag Ressourcer
fxisxneg2
Investigation 2
Untitled
Kopija Is the relation a function?
homework
Udforsk emner
Tangentlinje eller Tangent
Gennemsnit
Vektorer 3D (tredimensionelle)
Randomiserede variables
Kvadrat