Google Classroom
Google Classroom
GeoGebra
GeoGebra Classroom
Sign in
Search
Google Classroom
Google Classroom
GeoGebra
GeoGebra Classroom
Outline
Contour Plots
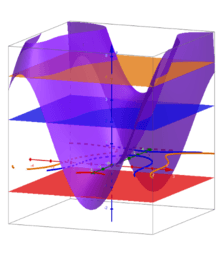
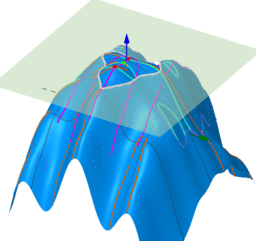
Contour plot and surface
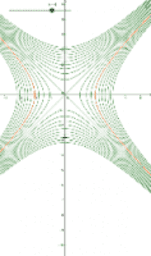
Function of several variables: several level curves
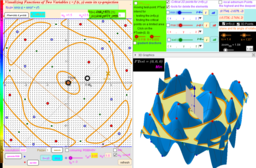
sin(x*y)+sin(x^2+y^2)- Images to Visualizing Functions of Two Variables
Visualizing Functions of Two Variables. Version 3
Contour Plots
Author:
Edward Wicks
Contour plot and surface
Function of several variables: several level curves
sin(x*y)+sin(x^2+y^2)- Images to Visualizing Functions of Two Variables
Visualizing Functions of Two Variables. Version 3
Next
Contour plot and surface
New Resources
apec
גיליון אלקטרוני להעלאת נתוני בעיה ויצירת גרף בהתאם
Random Polar Curve (3)
Slope and Road Signs
Angle Addition: Warm Up Exercises
Discover Resources
CCSS IP Math I 5.5.1 Example 4
Triangle Centers
Similar Triangles- Oil Well
Copying a line segment
Sum of Exterior Angles of Polygons
Discover Topics
Logarithm
Definite Integral
LCM and GCD
Orthocenter
Geometric Transformations