Google Classroom
Google Classroom
GeoGebra
GeoGebra Classroom
Anmelden
Suche
Google Classroom
Google Classroom
GeoGebra
GeoGebra Classroom
Kapitel
Statistik
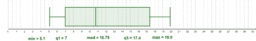
Dynamische Boxplots
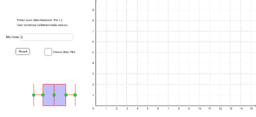
Match the Boxplot to Your Data
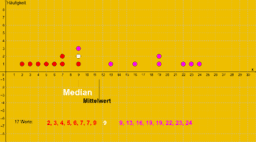
Median und Mittelwert
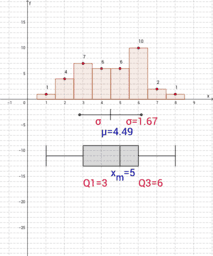
Graphische Darstellung von Daten und statistische Kennzahlen
Kennzahlen der Lage bzw. Streuung einer Verteilung
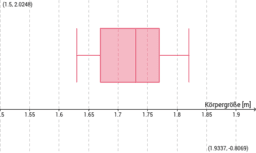
Statistische Auswertung der Körpergröße
Statistik
Autor:
Kurt Söser
Thema:
Boxplot oder Kastenschaubild
,
Statistik
Meine Sammlung von Statistik-Applets
Dynamische Boxplots
Match the Boxplot to Your Data
Median und Mittelwert
Graphische Darstellung von Daten und statistische Kennzahlen
Kennzahlen der Lage bzw. Streuung einer Verteilung
Statistische Auswertung der Körpergröße
Weiter
Dynamische Boxplots
Neue Materialien
Anleitung: Funktionsgraph einer homogen linearen Funktion zeichnen
Prozent & Dezimalzahl ineinander umrechnen
Vom Graphen zum Funktionsterm
Konstruieren das Inverse eines Punktes mit einem Zirkel
Ordne zu! - Funktionen und Steigung
Entdecke Materialien
Linearer Term
Umkehrfunktion - Ableitung
Baumhaus
string art 2 animated (Erik)
Schranke
Entdecke weitere Themen
Subtraktion
Balkendiagramm oder Säulendiagramm
Rechtwinklige Dreiecke
Mittelwerte
Rotation oder Drehung