Se connecter
Chercher
Contenu
Stats
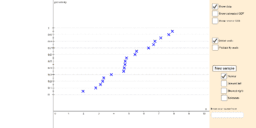
Normal probability plot
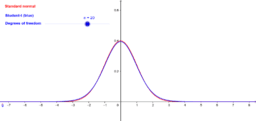
Comparison of the Student-t and Standard Nomal Distributions
Stats
Auteur :
ArmHacker
Normal probability plot
Comparison of the Student-t and Standard Nomal Distributions
Suivant
Normal probability plot
Nouvelles ressources
z`]]
Angle Addition: Warm Up Exercises
Hyperbolic Paraboloid
Rose Curve
Some random function
Découvrir des ressources
Axes grid
Parallelogram Properties activity 2
piecewise func
Height of Students in our Class
Rotation logo X
Découvrir des Thèmes
Fonctions Puissances
Dérivée
Fonctions en Escalier
Calcul
Graphe de Fonction