Google Classroom
Google Classroom
GeoGebra
GeoGebra Classroom
Anmelden
Suche
Google Classroom
Google Classroom
GeoGebra
GeoGebra Classroom
Kapitel
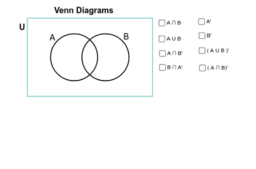
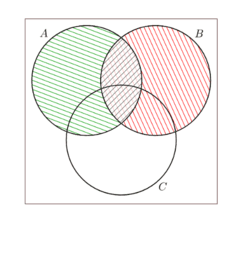
Venn Diagrams
Venn Diagrams
Illustrating set operations with Venn Diagrams
Venn Diagrams
Autor:
Kathryn Peake
Thema:
Diagramme
Venn Diagrams
Illustrating set operations with Venn Diagrams
Weiter
Venn Diagrams
Neue Materialien
רישום חופשי
Hyperbolic Paraboloid
Slope and Road Signs
Angle Addition: Warm Up Exercises
גיליון אלקטרוני להעלאת נתוני בעיה ויצירת גרף בהתאם
Entdecke Materialien
Modul 16-A_Rahmawati_SMA Negeri 03 Bombana
ベクトルの分解
Subtraction of decimals through Grid model
Quadratic Graphs - Explore Standard Form
Entdecke weitere Themen
Korrelation
Ähnlichkeitstransformation oder Ähnlichkeitsabbildung oder Ähnlichkeit
Gleichseitige Dreiecke
Polynomfunktionen oder ganzrationale Funktionen
Oberfläche