Google Classroom
Google Classroom
GeoGebra
Classe GeoGebra
Se connecter
Chercher
Google Classroom
Google Classroom
GeoGebra
Classe GeoGebra
Contenu
Algebra 1
Statistics
Solving Linear Functions and Inequalities
Graphing Linear Functions
Writing Linear Functions
Algebra 1
Auteur :
N.Andringa
,
Thomas Gebbie
Thème :
Algèbre
Table des matières
Statistics
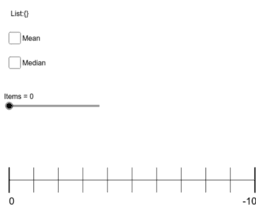
Dot Plot Generator
Box and Whisker Practice #2
Compare Box and Whisker Plots
Solving Linear Functions and Inequalities
Algebraic Proof Justification 1
Algebraic Proof Justification 2
Literal Equations Proof Justification
Graphing Linear Functions
Investigate the relationship between the three forms of line
First, use the sliders to create the parent function, y = x.
DIGI203-3D #8
Writing Linear Functions
Point Slope Form Matching
Slope Intercept Form Matching
Equivalent Linear Equations Matching
Suivant
Dot Plot Generator
Nouvelles ressources
အခြေခံ data အခေါ်အဝေါ်များ
Angle Addition: Warm Up Exercises
Cartesian vs Polar
Untitled
Model sferyczny - sześcian-ośmiościan
Découvrir des ressources
The quadratic formula
Example 3.81 OpenIntro AHSS
Triangle Inequality (II)
E4 Práctica Final
Congruent
Découvrir des Thèmes
Calcul
Carré
Géometrie
Parabole
Addition