Google Classroom
Google Classroom
GeoGebra
GeoGebra Classroom
Abrir sesión
Buscar
Google Classroom
Google Classroom
GeoGebra
GeoGebra Classroom
Esquema
Statistik
Boxplot-Diagramm
Section Control
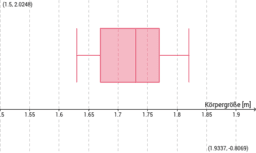
Statistische Auswertung der Körpergröße
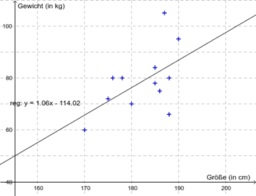
Zusammenhang Größe - Masse
Statistik
Autor:
Ulli Pletzer
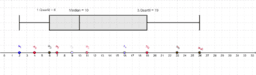
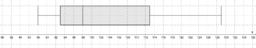
Boxplot-Diagramm
Section Control
Statistische Auswertung der Körpergröße
Zusammenhang Größe - Masse
Siguiente
Boxplot-Diagramm
Nuevos recursos
outfitkeuze
Ordne zu! - Funktionen und Steigung
Funktion gesucht!
Homogen lineare Funktionen
Anleitung: Funktionsgraph einer homogen linearen Funktion zeichnen
Descubrir recursos
Nullstellen ungerader Ordnung
Geraden: Formelschablonen
Actionbound Koblenz Winkelgröße Im Winkel
T 5.03 a
NMSIKSKMMAQ201_Steckbrief
Descubre temas
Triángulos
Fracciones
Cuadrado
Multiplicación
Parábola