Google Classroom
Google Classroom
GeoGebra
Aula GeoGebra
Valideu-vos
Cerca
Google Classroom
Google Classroom
GeoGebra
Aula GeoGebra
Esbós
statistics
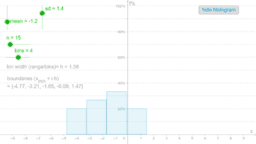
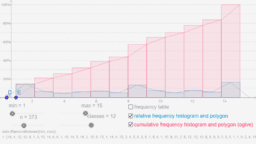
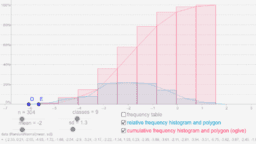
histograms
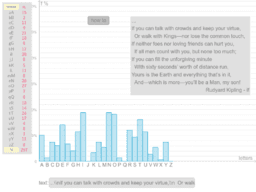
distribution of letters
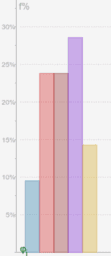
pie chart
Practicing Statistical Calculation-1
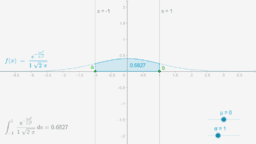
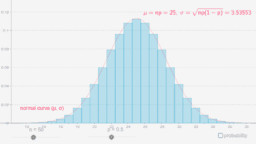
the bell curve
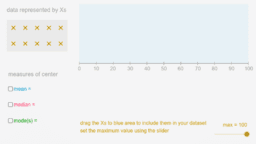
measures of center
pi digits
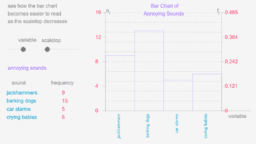
frequency scale
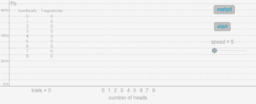
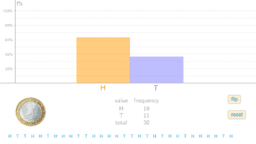
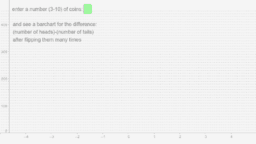
coin flipping-1
flipping a coin
binomial and normal
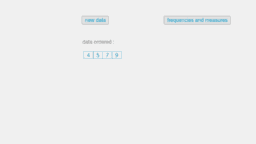
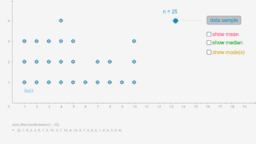
random data-1
random data-2
coin tossing simulation
dotplot
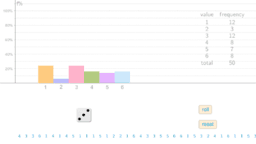
rolling a dice
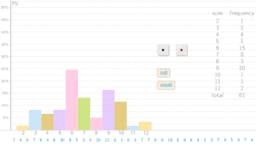
rolling two dice
statistics
Autor:
Seddoh Marianne
,
sonom
histograms
distribution of letters
pie chart
Practicing Statistical Calculation-1
the bell curve
measures of center
pi digits
frequency scale
coin flipping-1
flipping a coin
binomial and normal
random data-1
random data-2
coin tossing simulation
dotplot
rolling a dice
rolling two dice
Següent
histograms
Nous materials
Random Polar Curve (3)
Nikmati Keunggulan Di Bandar Judi Terpercaya
Rose Curve
Some random function
bewijs stelling van Pythagoras
Descobriu materials
Aufgaben zur Manipulation der Sinus- und Kosinusfunktion
Year 4: All About Nets
พีระมิด
(SSS) What Is Congruence (SSS)?
Descobriu Temes
Rectes
Intersecció
Trapezoide
Equacions
Mediana