Google Classroom
Google Classroom
GeoGebra
GeoGebra Classroom
Zaloguj się
Szukaj
Google Classroom
Google Classroom
GeoGebra
GeoGebra Classroom
Zarys
Wahrscheinlichkeit/Statistik
Beschreibende Statistik
relative Häufigkeiten als Schätzung für Wahrscheinlichkeiten
W'-Probleme
Wahrscheinlichkeit/Statistik
Autor:
claudia.v.moser
Temat:
Kombinatoryka
,
Prawdopodobieństwo
,
Statystyki
Spis treści
Beschreibende Statistik
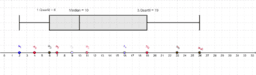
Boxplot-Diagramm
relative Häufigkeiten als Schätzung für Wahrscheinlichkeiten
12.1Probability of Counters in a Bag
Würfeln und relative Häufigkeit
Würfeln und relative Häufigkeit
W'-Probleme
Ziegenproblem
Das Buffon'sche Nadelproblem
Następny
Boxplot-Diagramm
Nowe zasoby
Prozent & Dezimalzahl ineinander umrechnen
Konstruieren das Inverse eines Punktes mit einem Zirkel
Erdbeeren pflücken mit Maria
Grafische Herleitung der 3. Binomischen Formel
Eine Folge algebraischer Kurven 2ⁿ-ten Grades
Odkryj zasoby
Zentrische Streckung Clown
Pol - Polare - Ballett
Aufgabe 1.50b
Polynom zur Erzeugung von Primzahlen
Mdl. Abitur
Odkryj tematy
Geometria
Trójkąty
Logarytm
Trapez
Geometria fraktalna