Google ClassroomGoogle Classroom
GeoGebraGeoGebra Classroom

IM1.8.5 Exit Ticket

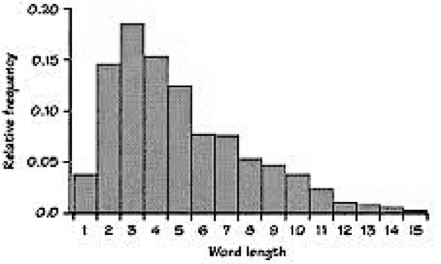
Image

1. Which of the following best describes the data graphed above?

Tick all that apply
  • A
  • B
  • C
  • D
Check my answer (3)

2. Which of the following best describes the data graphed above?

Tick all that apply
  • A
  • B
  • C
  • D
Check my answer (3)
The data above represent scores and win/loss data for an American football team.

3. What percentage of the scores would be found above the third quartile?

Tick all that apply
  • A
  • B
  • C
  • D
Check my answer (3)

4. What is the mean score? 5. What is the median score? 6. What is the mode score? 7. What percentage of games did the team win?