Google Classroom
Google Classroom
GeoGebra
GeoGebra Classroom
Abrir sesión
Buscar
Google Classroom
Google Classroom
GeoGebra
GeoGebra Classroom
Esquema
Statistik
Statistik
Statistik
Autor:
matte Lena
Statistik
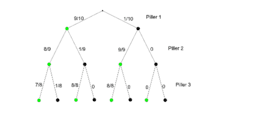
Dynamisk träddiagram Scherlock
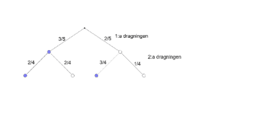
Dynamisk träddiagram
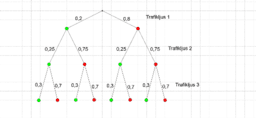
Dynamisk träddiagram trafikljus
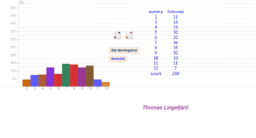
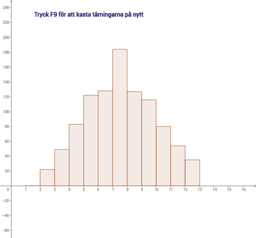
Kasta två tärningar och mät summan
Kast med två tärningar
Siguiente
Dynamisk träddiagram Scherlock
Nuevos recursos
Untitled
רישום חופשי
Rose Curve
Random Polar Curve (3)
Model sferyczny - sześcian-ośmiościan
Descubrir recursos
MYP Assesment
Pytagoras
Poster #2
Função Afim
Chapter-38-1-1: normal vectors
Descubre temas
Funciones Trigonométricas
Seno
Cilindro
Sustracción
Funciones partidas