Google Classroom
Google Classroom
GeoGebra
GeoGebra Lesson
Sign in
Search
Google Classroom
Google Classroom
GeoGebra
GeoGebra Lesson
Outline
Year 10
Trigonometry
Year 10
Author:
Susan Hauser
Interactives for Year 10A
Trigonometry
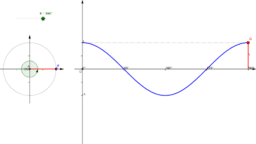
Graph of the Sine Function
Graph of the Cosine Function
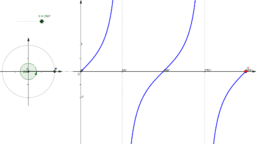
Graph of the Tangent Function
The Unit Circle
Next
Graph of the Sine Function
New Resources
Linear Combination of Vectors
Basic and Compound Inequality Illustrator
Marion's Theorem
Graphing Basic and Compound Inequalities
Rossler's Attractor
Discover Resources
Light in GeoGebra (2)
Rectangle and Triangle Area Relationship
A great MIT applet
Unit Circle 45
Similar Figures
Discover Topics
Right Triangles
Bar Chart or Bar Graph
Boxplot
Tree Diagrams
Piecewise Functions