Drawing a Straight Line Graph using known points
To draw a straight line graph using known points in GeoGebra is a little trickier. First you have to plot the points first.
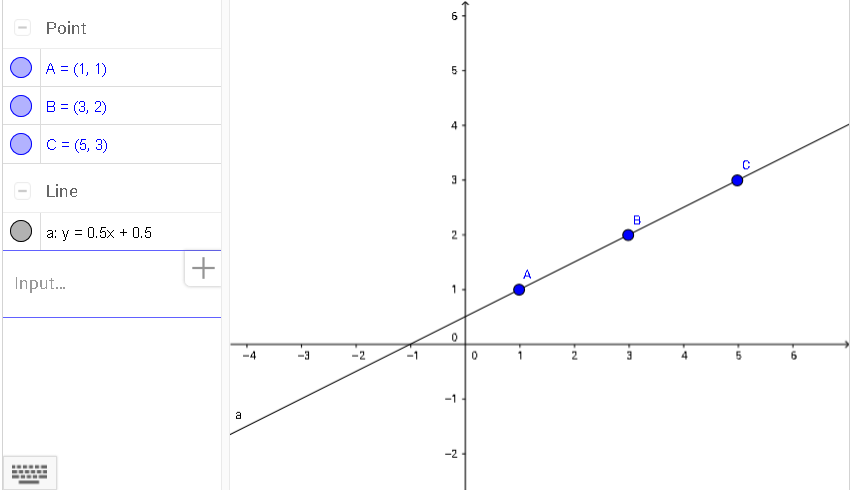
This is done by typing in the points in the form of (x,y) in the input bar. Try typing
in (1,1). Next (3,2). And then (5,3). See how the points are plotted?
Also note that the points are alphabetically labelled with capital letters.
Next, type in: FitLine(A,B,C) to draw the graph. See how the equation of the line is also generated.
Your End Product should look something like this: