Google Classroom
Google Classroom
GeoGebra
GeoGebra Classroom
Sign in
Search
Google Classroom
Google Classroom
GeoGebra
GeoGebra Classroom
Outline
AP Stats
AQR Section 17: Calculating Summary Statistics
AQR Section 16: Five Number Summary Exploration
AQR Section 17: Dot Plot and Box-and-Whisker Plot
AQR Section 17: Creating a Box and Whisker Plot
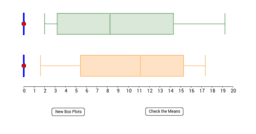
AQR Section 17: Where's the Mean?
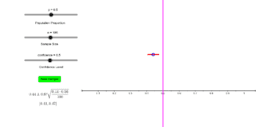
Confidence Interval for a Proportion
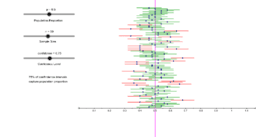
Exploring a Single Confidence Interval for a Proportion
AP Stats
Author:
Steve Phelps
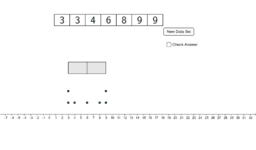
AQR Section 17: Calculating Summary Statistics
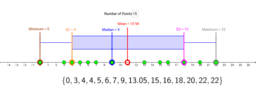
AQR Section 16: Five Number Summary Exploration
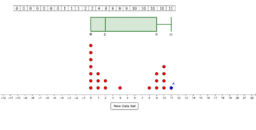
AQR Section 17: Dot Plot and Box-and-Whisker Plot
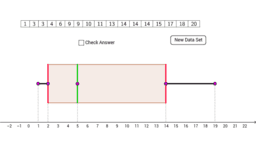
AQR Section 17: Creating a Box and Whisker Plot
AQR Section 17: Where's the Mean?
Confidence Interval for a Proportion
Exploring a Single Confidence Interval for a Proportion
Next
AQR Section 17: Calculating Summary Statistics
New Resources
apec
Slope and Road Signs
Untitled
Hyperbolic Paraboloid
Nikmati Keunggulan Di Bandar Judi Terpercaya
Discover Resources
Task2
Katie_McCoy_Qtr1project_B4
Parallelogram Properties
Math
Geogebra
Discover Topics
Secant Line or Secant
Equilateral Triangles
Correlation
Confidence Interval
Complex Numbers