Google Classroom
Google Classroom
GeoGebra
GeoGebra Lesson
Sign in
Search
Google Classroom
Google Classroom
GeoGebra
GeoGebra Lesson
Outline
sin cos
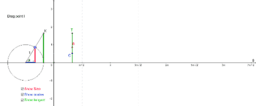
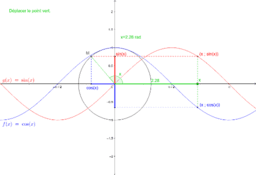
Graphs of sin, cos and tan generated from a circle
Fonctions sinus et cosinus
sin cos
Author:
Valerie Tamboise
Graphs of sin, cos and tan generated from a circle
Fonctions sinus et cosinus
Next
Graphs of sin, cos and tan generated from a circle
New Resources
Deciding How New Information Affects Probability
Squaring a Rectangle (PST Version)
Rovnoběžnost rovin
Conditional Probability in Two-Way Tables
Rotating Plane Figures to Form Solids
Discover Resources
Sketching Polynomials
test
Ind: TorqueSimple의 복사본
Modul9B_Karyoni Asri_SMA N 1 Gerokgak
MODUL 15D_YANI NURCAHYANI_SMPN 2 SUKABUMI
Discover Topics
Geometric Distribution
Vectors 2D (Two-Dimensional)
Line Segment
Set Theory
Pie Chart or Circle Chart